, while a stagflation prediction would require policy tightening, seen in the 1980s recessions.)
Part II: Quantifying Episodes of Soft-Landing, Stagflation and Recessions
Summary
- In the second part of the series, we quantify episodes of soft-landings, stagflation and recessions during the post-1950 period.
- To the best of our knowledge, we are the first to present a framework to quantify periods of soft-landing for the U.S. economy.
- Our work estimates that there are 13 episodes of stagflation and 13 episodes of soft-landings in the post-1950 era.
- According to the NBER, there are 11 recessions during the same period.
- In the next installment of the series, we’ll introduce a probit framework to generate four-quarter-out probabilities of the three scenarios. These probabilities would be helpful to determine the magnitude and duration of upcoming policies, as monetary policy decisions are influenced by the near future economic outlook.
Soft-Landing, Stagflation and Recessions: The Three Potential Drivers of Monetary Policy Stances
The first part of the series introduced our framework to characterize the U.S. economic outlook into three regimes: recession, soft-landing and stagflation. As we discussed in Part I, we divide the economy into three regimes because they are structurally different and thus lead to different monetary policy stances, all else equal. For example, a recession forecast would dictate an accommodative policy stance (as seen in the past four recessions), while a stagflation prediction would require policy tightening, seen in the 1980s recessions.
To the best of our knowledge, we are the first to develop a framework to quantify periods of soft-landings for the U.S. economy. In a series published earlier this year, we estimated that there were 13 episodes of stagflation taking place in the post-1950 period, five of which were mild, four that were moderate and four that were severe. According to the National Bureau of Economic Research (NBER), there have been 11 recessions since 1950. Using these historical episodes, an analyst can build a framework to generate the probability of each scenario occurring in the near-term. Knowing these probabilities could help shine light on the potential path of monetary policy.
Quantifying Episodes of Soft-Landings: A New Approach
In our approach, we assume that a period of weak economic growth would ask for accommodative monetary policy to jump-start the economy, while strong growth may require contractionary policy to avoid overheating, all else equal. A trend-like growth period (a Goldilocks economy, for example) may be neutral ground for monetary policy. Thus, we define a soft-landing as a trend-like growth period.
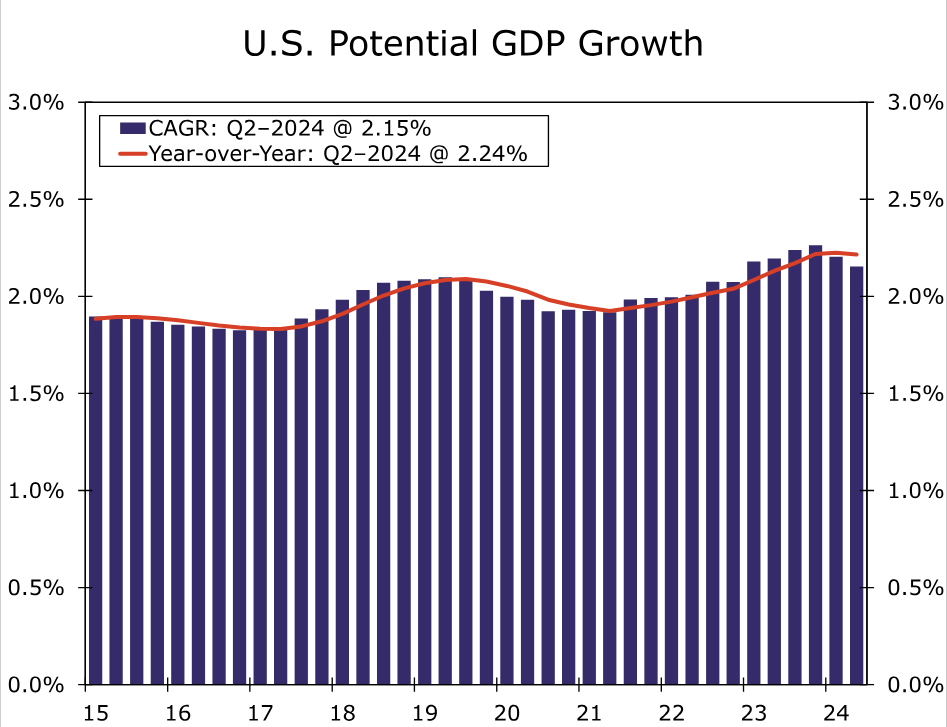
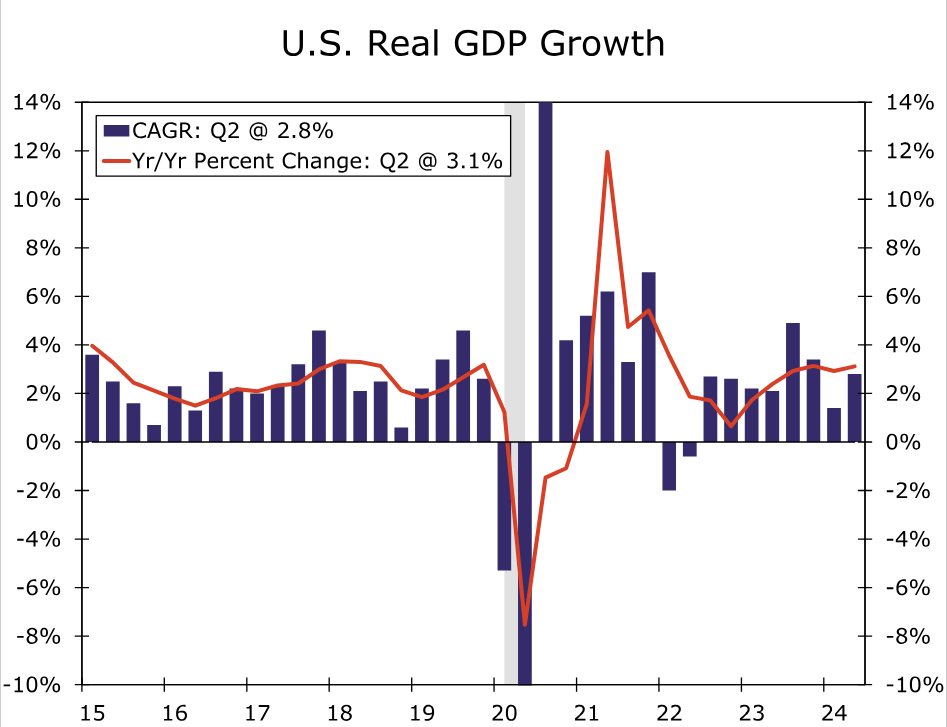
We utilize Congressional Budget Office’s (CBO) potential real GDP series for the U.S. economy (Figure 1) as a benchmark to identify periods of soft-landings. Additionally, we use the real GDP growth rate as a measure of the economy’s output (Figure 2). In our approach, we compare the magnitude and duration of actual output growth with CBO’s projections of real GDP.
We employ a time-varying approach to capture the evolving nature of the economy. In the first stage, we utilize NBER business cycle dates to divide CBO’s potential real GDP growth rates into periods of recession and expansion. In the second stage, we characterize each expansion period into episodes of weak or strong soft-landings using the mean and standard deviation of the previous expansion as a baseline. In a real-time analysis, we would only know the past and present data, so we compare the current period’s growth rate with the previous business cycle expansion’s average value to judge whether it is a weak or strong soft-landing.
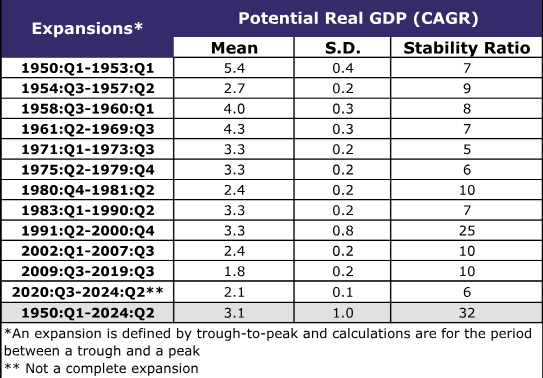
There are 12 expansions in our sample of the post-1950 period. We calculated the average growth rates along with the standard deviations and stability ratios (the standard deviation as a percent of the mean) for each of those 12 expansions. The results are displayed in Table 1.1 The expansion following the 1948–1949 recession had the strongest average potential growth rate, with a value of 5.4%. The weakest expansion in our analysis was the expansion following the Great Recession, with a 1.8% average potential growth rate.
To determine whether the expansion was a weak or strong soft-landing, we multiplied the standard deviation of the previous expansion by two and then added and subtracted that from the previous expansion’s average growth rate to determine a threshold. For example, when determining the threshold for the expansionary period after the pandemic, we multiplied the standard deviation of the post-Great Recession expansionary period by two and added and subtracted that by its average potential growth rate. The calculated range would therefore be 1.4%–2.2%. So, if real GDP growth in the post-pandemic recessionary period stayed in between 1.4% and 2.2%, it would be considered trend-like growth. If it exceeded the upper limit of 2.2%, it would be characterized as strong growth. Likewise, if it fell under the lower limit of 1.4%, it would be characterized as weak growth.2 (Table 1)
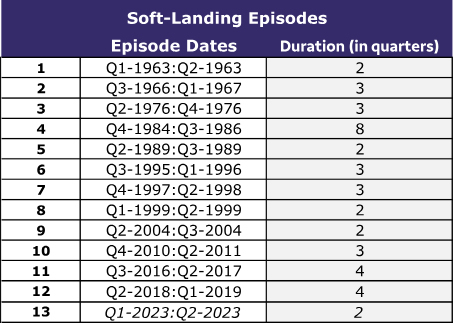
To determine the duration component of our approach, we followed the “technical recession” definition of two consecutive quarters of negative real GDP growth and set a minimum duration of two consecutive quarters of real GDP growth rates that stay within the threshold (i.e., the mean +/- two standard deviations) to classify an episode of soft-landing. Sticking with two consecutive quarters as a minimum threshold helps to remove noise from the data and provides more useful signals, in our view. For example, in our analysis, the first episode of soft-landing is for the Q1:1963–Q2:1963 period, as two consecutive quarters of real GDP growth rates stayed within the range of 3.4%–4.6% (the GDP growth rates were 3.6% and 3.8% for Q1 and Q2 1963, respectively).
Based on these criteria, our framework estimated that there are 13 episodes of soft-landings in the post-1950 era (Table 2). The longest duration of any soft-landing period was eight quarters, which occurred during Q4:1984–Q3:1986, and five episodes shared the shortest duration of two quarters. According to our analysis, the last episode of soft-landing lasted only two quarters and ended in Q2–2023. Since the last episode of soft-landing, GDP growth rates have stayed above the upper-limit of the threshold most of the time (Appendix).
Testing, Not Assuming, Would Be a Better Way To Project the Near-Term Policy Path
Rather than assuming that the FOMC may repeat the past easing cycle’s behavior, we suggest that predicting the potential growth scenarios is a better path, as it is more consistent with the FOMC’s mantra of “data-dependent decision-making.”
We believe NBER’s recession dates methodology and our approach of soft-landing episodes are valuable inputs to policy decisions, as they capture the recession risk and the soft-landing scenario. Including our stagflation work in the mix would complete the three major economic scenarios for monetary policy decision-making. In the next installment of the series, we’ll introduce a probit framework to generate four-quarter-out probabilities of the three scenarios. By predicting the near-term likely growth scenario, the probit framework could be a valuable input to project the possible path of the upcoming easing cycle.
Endnotes
1 – We employ the compound annual growth rate (CAGR) of both potential and actual real GDP. The CAGR form is a widely utilized gauge of the current run-rate of the economy. For example, when NBER determines U.S. business cycle dates, it uses the CAGR transformation of real GDP, in addition to other variables, to determine a given recession’s peak and trough.
2 – We employed two S.D. plus/minus the mean to establish upper and lower limits of our threshold to determine periods of soft-landings. We followed the so-called “Three-Sigma” rule where mean plus and minus two S.D. would capture about 95% of the data series—i.e. the statistical confidence level would be 95%. For more detail about the Three-Sigma rule, see Huber, Franz. 2018. A Logical Introduction to Probability and Induction. New York: Oxford University Press, 2018.
Appendix
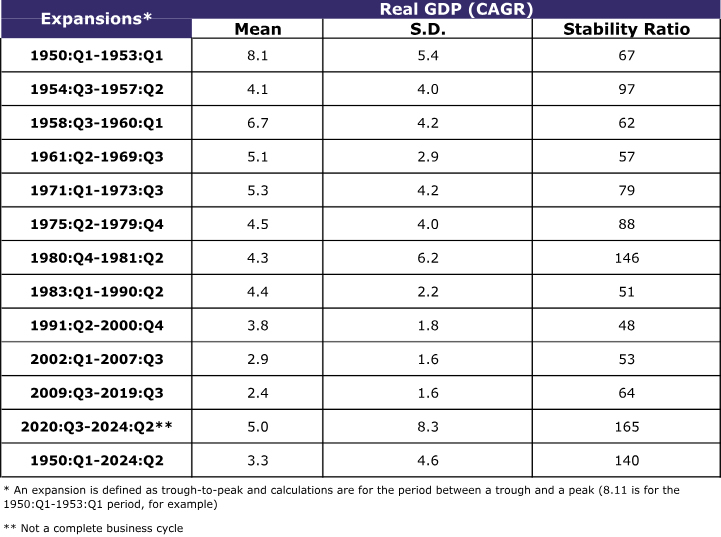
As a robustness check to our proposed framework, we explore alternatives to our employed benchmark of CBO’s potential real GDP series. One alternative could be the real GDP growth rate akin to NBER’s recession approach that heavily relies on real GDP in addition to several other variables. We provide mean, standard deviation and stability ratios based on real GDP (CAGR) for each expansion since 1950, like in Table 1. The largest mean is 8.1% for the 1950–1953 expansion, and the lowest average value of 2.4% is associated with the post-Great Recession era. The stability ratio column indicates that the series is very volatile, as the smallest value is 48 (the S.D. is about half of the average value) for the 1991–2000 expansion. Moreover, the two S.D. rule would be misleading, as the smallest two S.D. is 3.2% (for the post-Great Recession era), which would create a wide range of -0.8% and +5.6% and declare the entire post-Great Recession era as a soft-landing. Therefore, we stick to CBO’s potential real GDP as a benchmark to identify soft-landing episodes.