
Hello, traders! Welcome to a new blog post where we discuss how our Blue Box strategy helps ElliottWave-Forecast members identify high-confidence trade opportunities across 78 instruments. In this post, we’ll focus on the FTSE. The $FTSE is an index that tracks the top 100 companies listed on the London Stock Exchange by market capitalization.
The FTSE ended a decline that lasted over 22 months in March 2020. Since bottoming out in March 2020, the index has recovered in an impulsive wave structure for most of the last four years. To assist our members in tracking this 4-year bullish cycle, we update the weekly FTSE chart every weekend to prepare them for the week ahead. We also update daily, H4, and H1 charts for all 78 instruments over the weekend. Below is the most recent weekly chart, which we shared on 08.03.2024
FTSE Weekly Chart, 08/03/2024
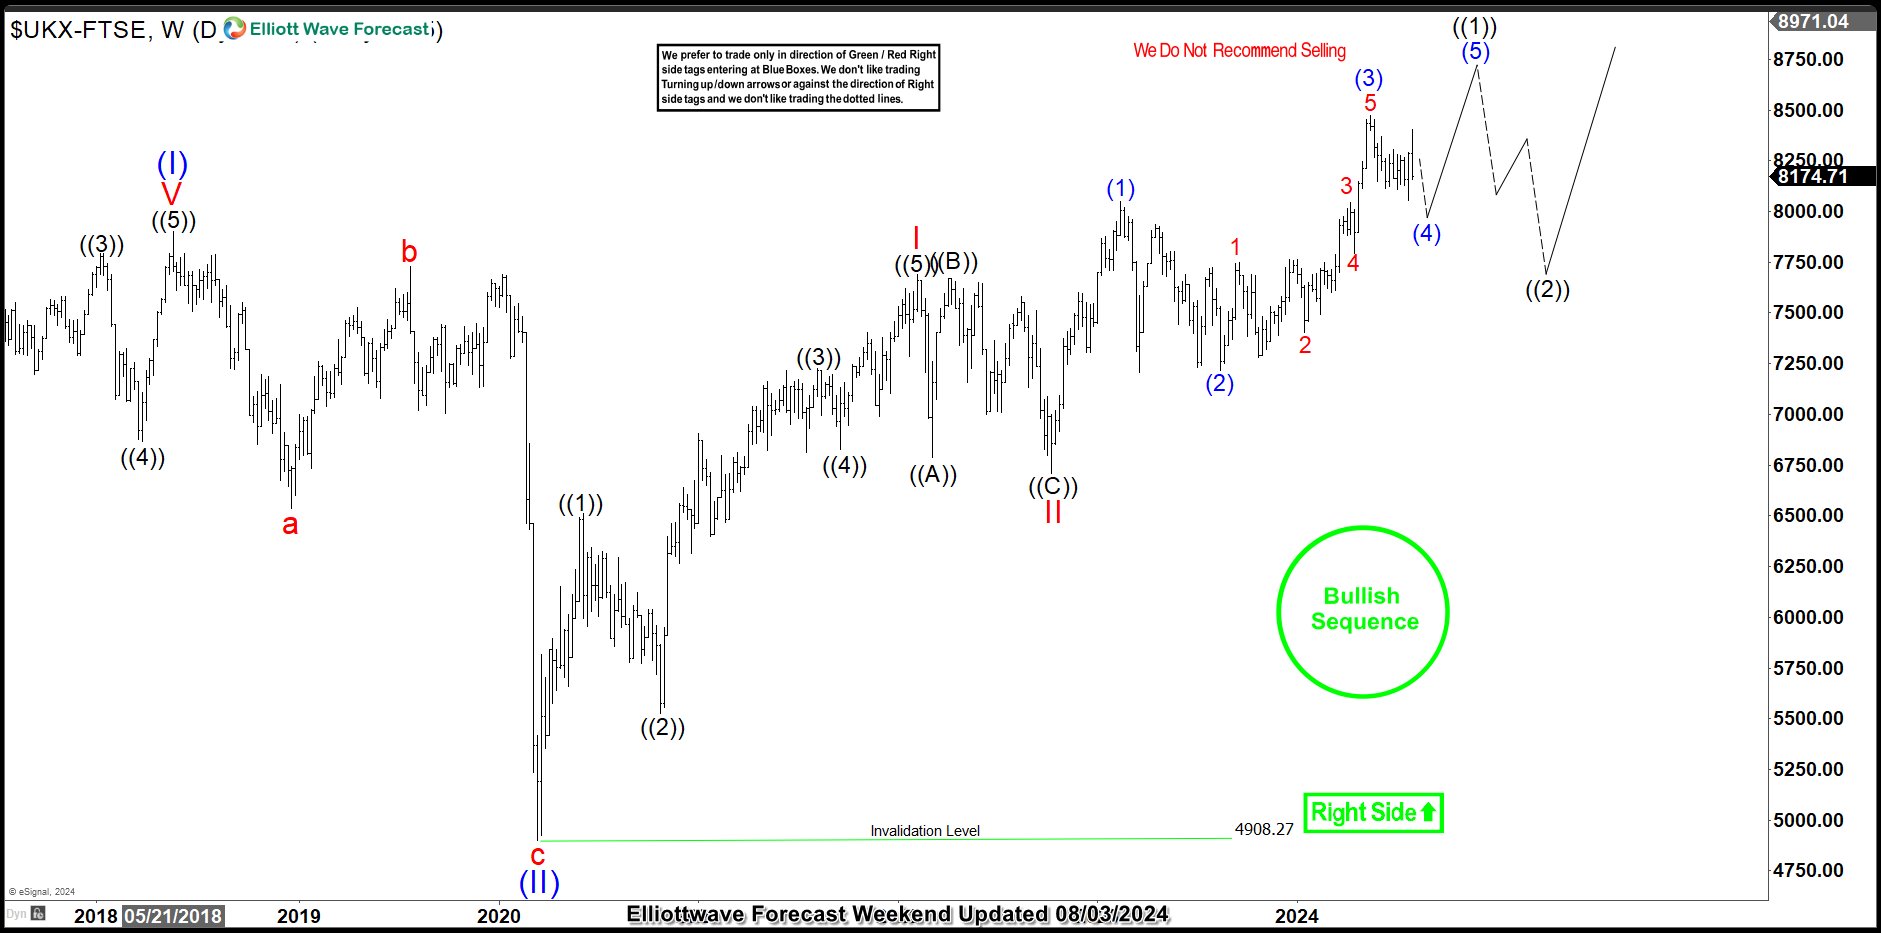
In the weekly chart above, the impulse cycle from March 2020 represents wave (III) of the Supercycle degree. Price has completed waves I and II of (III) and is now in wave III of (III). Within wave III, the price was in wave (4) of ((1)) of III. Based on this, we anticipated one more swing high to complete wave (5) of ((1)) of III. Once the impulse cycle for ((1)) is complete, we expect a larger pullback in ((2)) before the broader bullish impulse cycle for III of (III) continues. This chart helps us understand the current price position within the larger framework of price action.
Naturally, we focused on buying opportunities and avoided selling, when in a bullish sequence. Therefore, we recommended that members buy the wave 4 pullback when it completes a 3, 7, or 11 swing pullback at the extreme of the corrective sequence
FTSE 4-Hour Chart, 08/03/2024
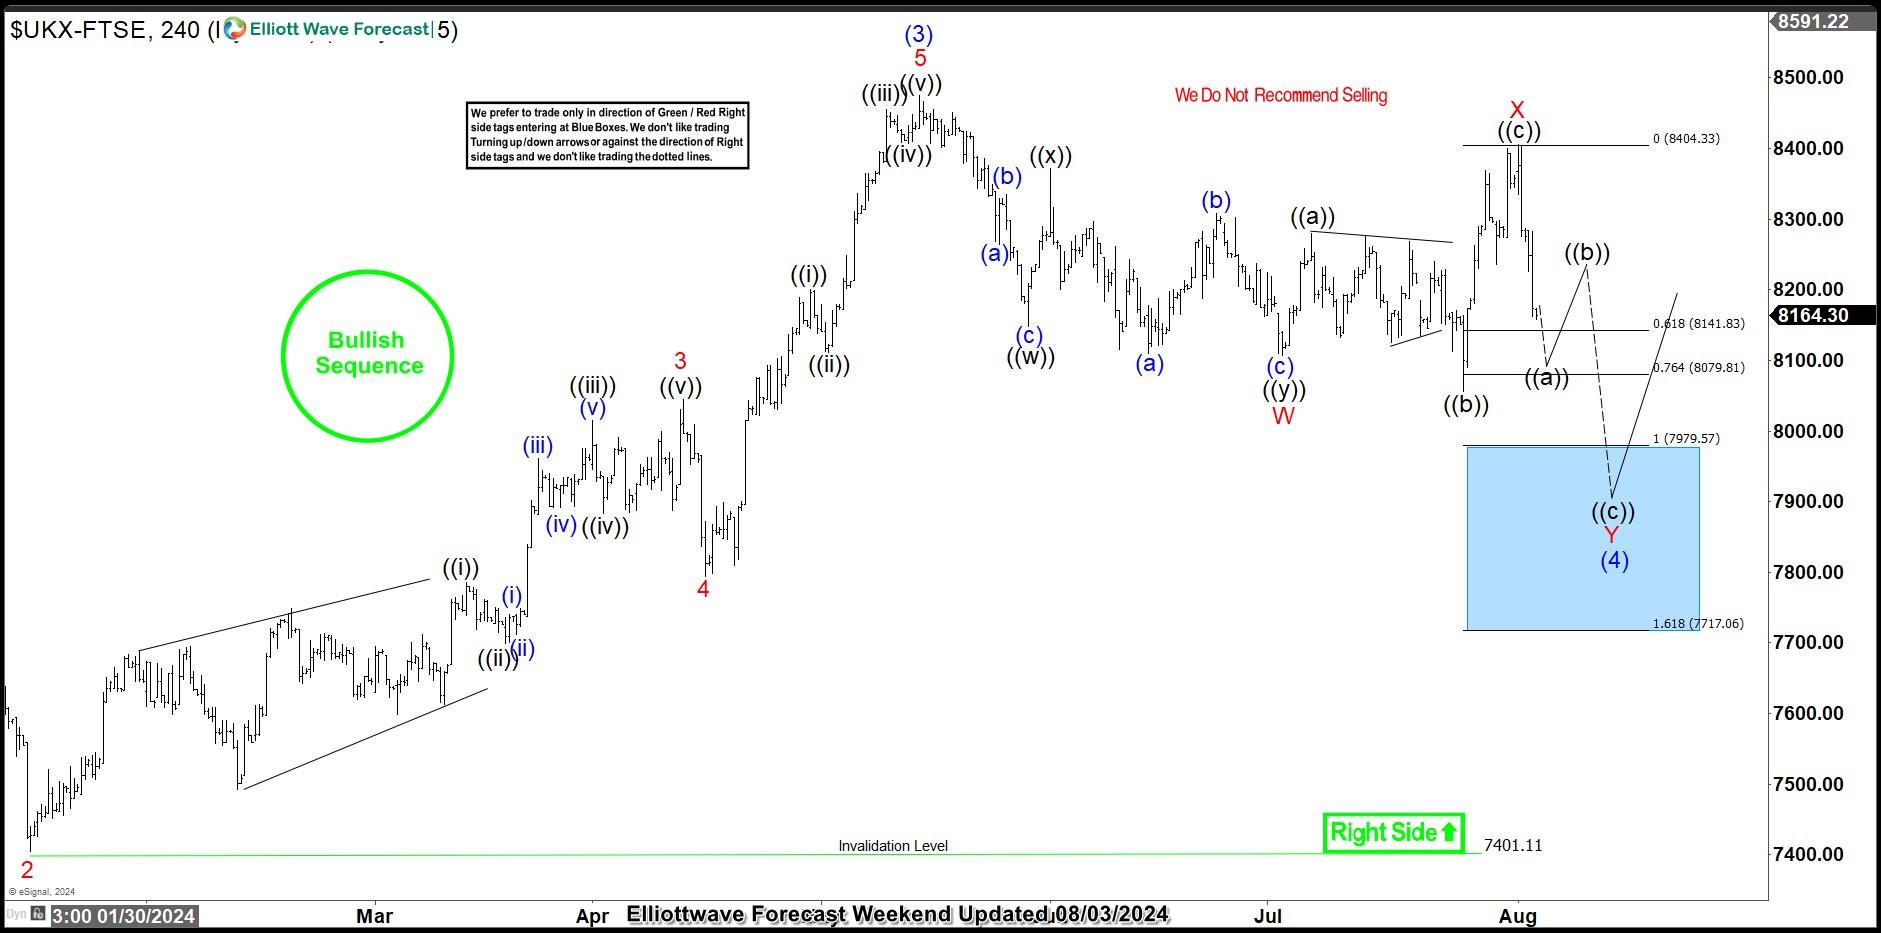
On the same weekend, 08.03.2024, we shared the H4 chart above with our members. This chart illustrates the sub-waves of wave (4). From this chart, we identified that the index was close to completing a double zigzag (7-swing) structure within the 7979.57 to 7717.06 range. Therefore, the trade plan was to buy at 7979.57 or below, with a stop placed below 7717.06, as this would indicate that the corrective structure had become overstretched and thus unreliable.
FTSE 4-Hour Chart, 08/07/2024
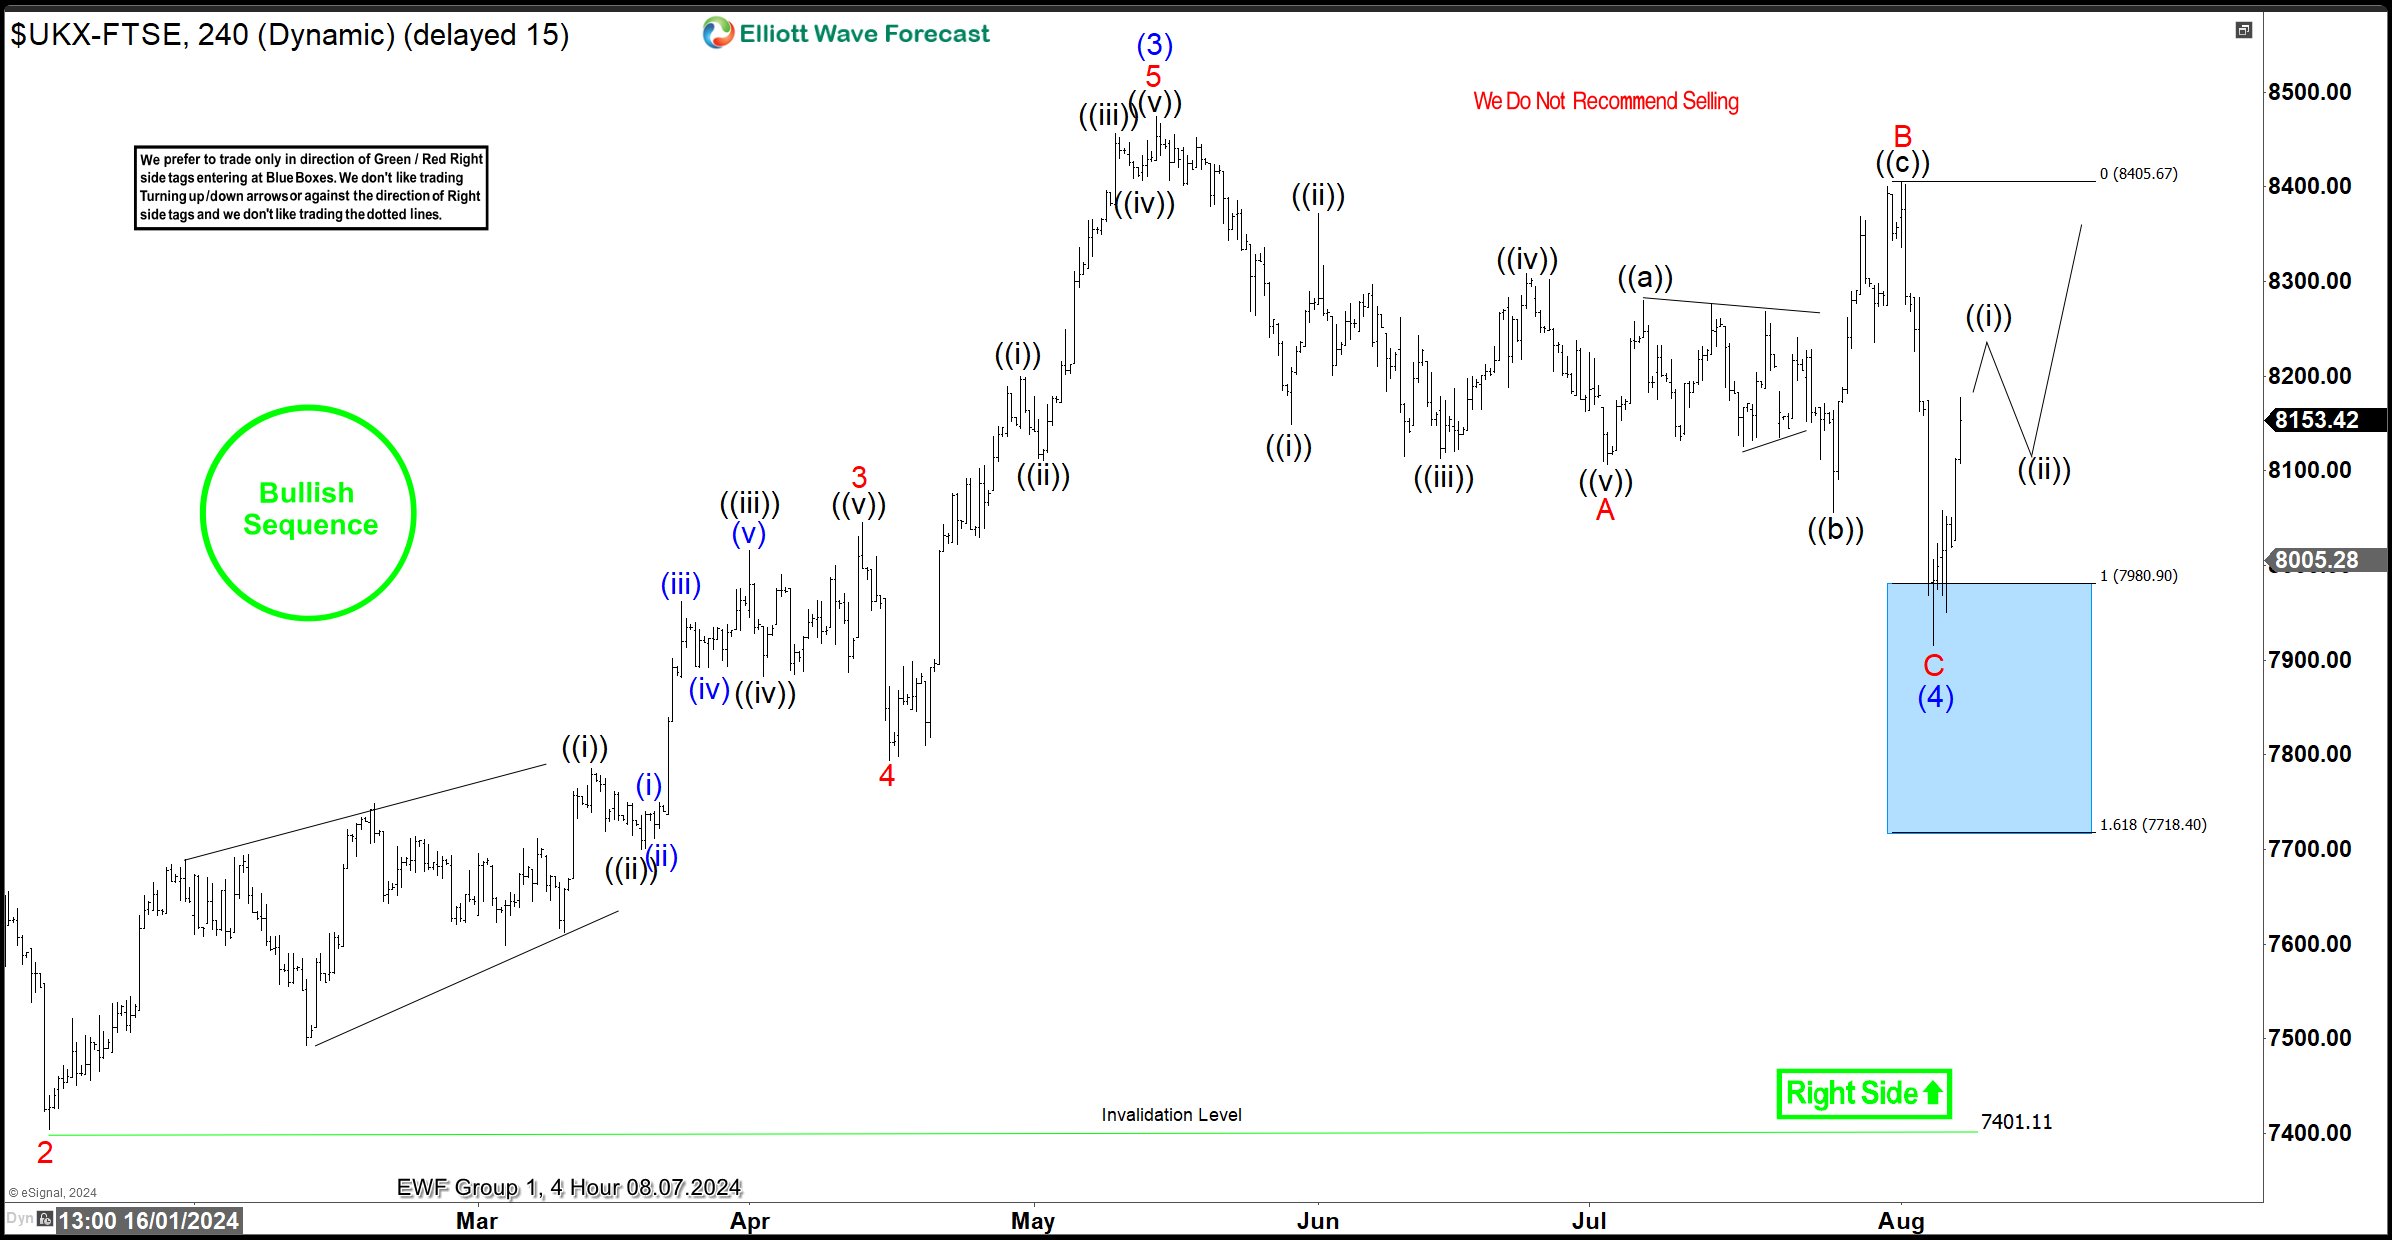
The chart above shows FTSE’s reaction at the time of writing this post. The index dropped into the Blue Box to complete wave C of (4). As expected, it quickly bounced off the box and moved away from it. Meanwhile, after reaching 8159, the trade plan was to close half of the position and adjust the stop for the remainder to break even. This approach allowed members to secure some profits while cutting risk to zero. Moving forward, we anticipate an impulsive recovery for wave (5). Currently, the price is in wave ((i)) of 1 of (5). We expect either a full recovery above the wave (3) top or at least a 3-swing bounce.
Two outcomes are possible. Firstly, the price could recover above the wave (3) top, allowing members to hold for further gains. Secondly, it could complete a 3-swing bounce and drop back below the box, reaching a new extreme. In the latter scenario, members have already secured profits and face no risk. Meanwhile, our analysts will continue working around the clock to provide updates on FTSE and 77 other instruments, from weekly down to the 30-minute/1-hour time frame.