
There is a classic risk aversion in the markets, reminiscent of what we saw some 16 years ago in 2008. The sell-off in U.S. markets does not look extreme yet, although Japanese markets are recording their worst day since Black Monday 1987, and trading has been suspended in Korea, Turkey and Taiwan. The spike in long bond prices fits into a pattern of classic risk flight.
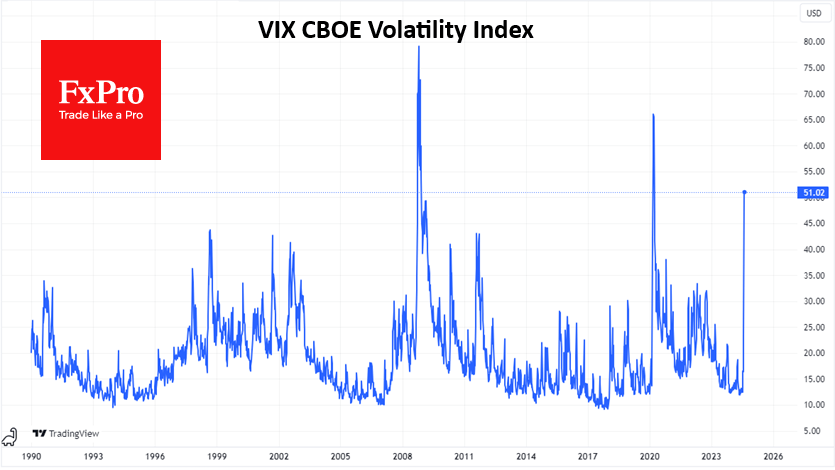
The VIX topped 50 on Monday morning and has only been higher from March to April 2020 in the last 15 years. This is an important indicator that shows markets are genuinely concerned about rising volatility in the near term rather than just regular portfolio rebalancing.
August started with active selling in the US markets.
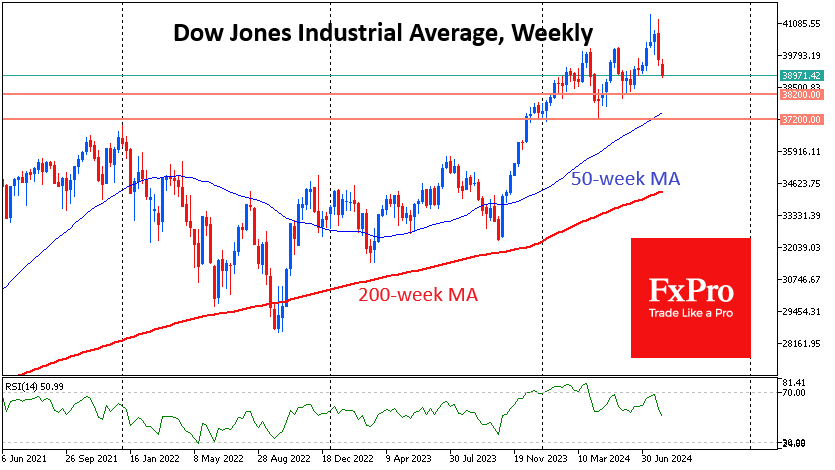
By the middle of the trading session in Europe, the Dow Jones index had pulled back to 39000, losing about 5% from its peak just before the close of trading on 31 July. Since the start of trading this week, the index has been trading below the 50-day moving average, an important medium-term trend line. A consolidation below it would be a prologue to a decline to the 200-day area, which is now near 38150. The behaviour of the index in the 37200-38200 area is extremely important to understand the sentiment as it is a former resistance that became a support in April. There are still doubts about whether it will keep its latest status.
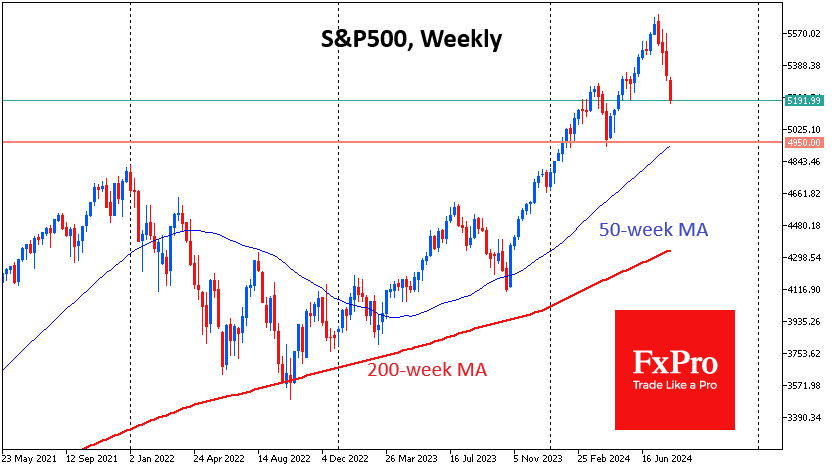
The S&P500 index is one step ahead of the Dow Jones in terms of the market cycle. Since the beginning of August, it has fallen below the support of the upside corridor that has been in place since October 2023. The fight for the 50-day here was lost by the bears as early as 1 August, and the index is already near 5200. This is below the peak area in March, which was supported in May. The next comparable support is not seen before 4950-5050 (April lows and 200-day MA).
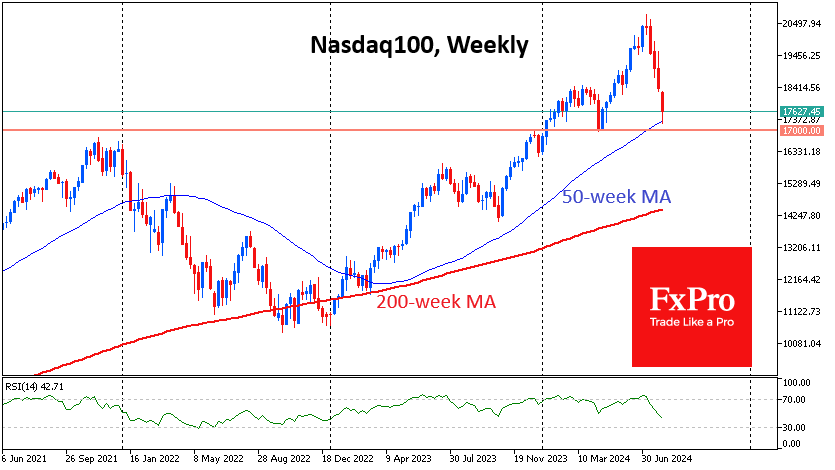
The Nasdaq100 is still one step ahead in this down cycle, having already dipped below 17250 on Monday, below its 200-day MA (now at 17777). The index consolidated above it in January 2023, and since then, it has triggered heavy buying, acting as a turning point in corrections. Monday or Tuesday will decide which pattern will prevail: a bear market like in 2022 or an attractive drawdown for buyers.
Investors should prepare for further dips and not be in a hurry to catch falling knives, given that we are seeing reactions to macroeconomic data, the height of the VIX, and the speed and synchronisation of declines across many markets.
Don’t be confused by the weakening dollar and the relatively robust performance of gold. The sell-off in markets is still at an early stage, not generating waves of deleveraging with forced selling.
A fall of the Nasdaq100 below 17000 will start a bear market with the potential to fall to 14500 (200-week average). In the S&P500, the 200-week is also acting as a historical support line. It is now near 4350 but is targeting the 4500 area by year-end. In the Dow Jones, the 35000 area is a similar benchmark.
Perhaps only a quick dip into this area could force the Fed to make an emergency rate cut. Also, such a pullback would provide the necessary attractiveness to stock valuations. But one must realise that at this point, near the 200-week average, markets become extremely volatile. Marking a point from which to look out for buys does not automatically make them. It makes sense to join purchases only after decisive steps of the Central Bank and the government. Expectations of such a step early on Monday morning look like market inefficiency rather than the real hopes of traders.