The financial markets were marked by significant turbulence this last week again, dominated by risk aversion. Evidence are surfacing that the US economy is heading for a recession, or even hard landing. Speculation is mounting that Fed might be compelled to implement aggressive rate cuts, totaling 75 basis points or even a full percentage point by year-end, in response to the worsening economic outlook. However, there’s a palpable lack of confidence among investors that even such decisive action could prevent further economic deterioration.
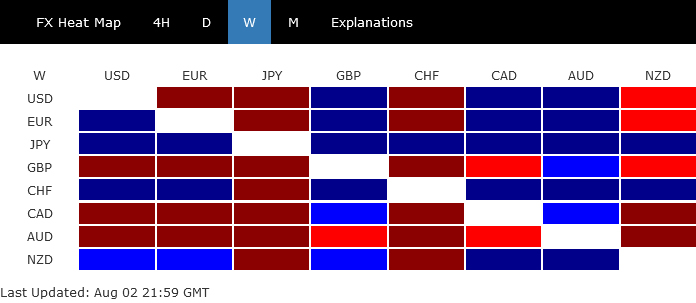
The ongoing steep selloff in U.S. stocks has evolved beyond previous discussions of mere sector rotation or pre-election repositioning. Instead, it’s increasingly viewed as a flight to safety, with investors moving capital into traditional safe havens. This shift has resulted in a surge in U.S. bonds, which pushed the benchmark Treasury yield below 4%, and bolstered Yen and Swiss Franc, which emerged as the week’s strongest performers.
Conversely, commodity currencies and British Pound faced additional selling pressure, except for the New Zealand Dollar, which paradoxically benefited from the broader selloff in Australian Dollar. While Euro and Dollar are both positioned in the middle of the performance chart, Euro has clearly outperformed the greenback.
US Markets Plunge as Sahm Rule Points to Looming Recession
Sentiment in the US financial markets took a significant downturn, primarily driven by a series of negative economic indicators that heightened fears of an impending recession. The activation of the “Sahm Rule,” alongside ongoing yield curve de-inversion, has particularly unnerved investors. The development also casts significant doubt on the wisdom of Fed’s decision to maintain interest rates at 5.25-5.50 on Wednesday.
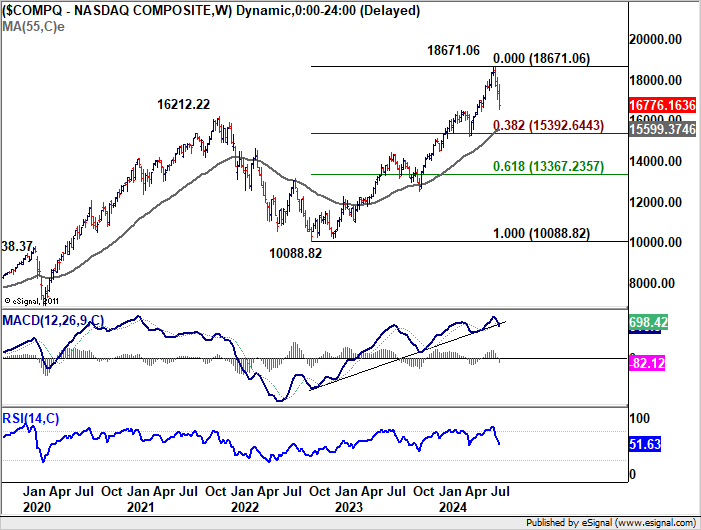
Market performance was starkly negative across major indices. NASDAQ was particularly hard hit, falling into correction territory with -3.35% weekly decline, marking a drop of over -10% from its historical high made less than a month ago. Similarly, S&P 500 and DOW lost -2.06% and -2.10% respectively, with their values now sitting -5.7% and -3.9% below their all-time highs. Moreover, 10-year Treasury yield saw a significant drop, plunging through 4% mark to close at 3.792%, while Dollar Index shed over -1%.
To start to explain the situation, the initial wave of negativity was triggered on Thursday by disappointing ISM manufacturing data, with the PMI falling deeper into contraction and both production and employment reaching their lowest levels since mid-2020. This was followed by an even sharper downturn after the release of the July non-farm payroll report.
The mood darkened further as NFP revealed that employment grew by only 114k in July—substantially below expectations and the average monthly gain of 215k over the past year. More crucially, the rise in the unemployment rate from 4.1% to 4.3% triggered the “Sahm Rule,” a historically reliable indicator of recession.
Developed by Claudia Sahm, a chief economist at New Century Advisors and former Federal Reserve Board economist, the “Sahm Rule” states that the economy is likely in a recession if the three-month average unemployment rate exceeds the 12-month low by at least 0.5%. July’s increase pushed the three-month average unemployment rate above 4.1%, surpassing the 12-month low of 3.5% by more than the crucial 0.5% threshold.
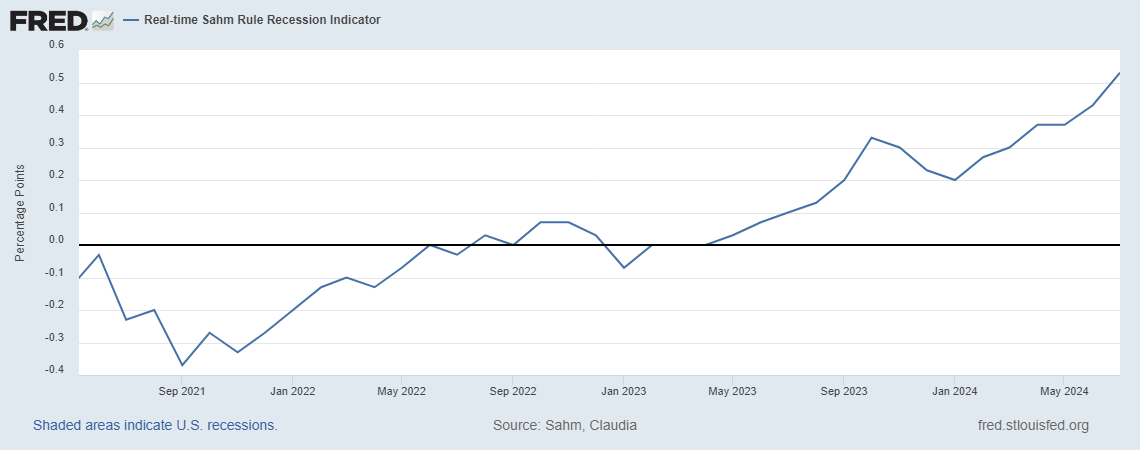
In response to the growing anxiety, Claudia Sahm sought to temper concerns in a Fortune interview, stating, “I am not concerned that, at this moment, we are in a recession,” and urging that “no one should be in panic mode today, though it appears some might be.” But she still acknowledged the rule’s historical reliability, noting that “recessions can build slowly, and then come quickly.”
Further emphasizing the seriousness of the situation, former New York Fed President William Dudley highlighted recently that once the 0.5% threshold is breached, unemployment typically continues to rise significantly, with the smallest historical increase being nearly 2% from trough to peak. This historical perspective adds context to why investors are particularly unnerved, underpinning the drastic shifts in market dynamics observed last week.
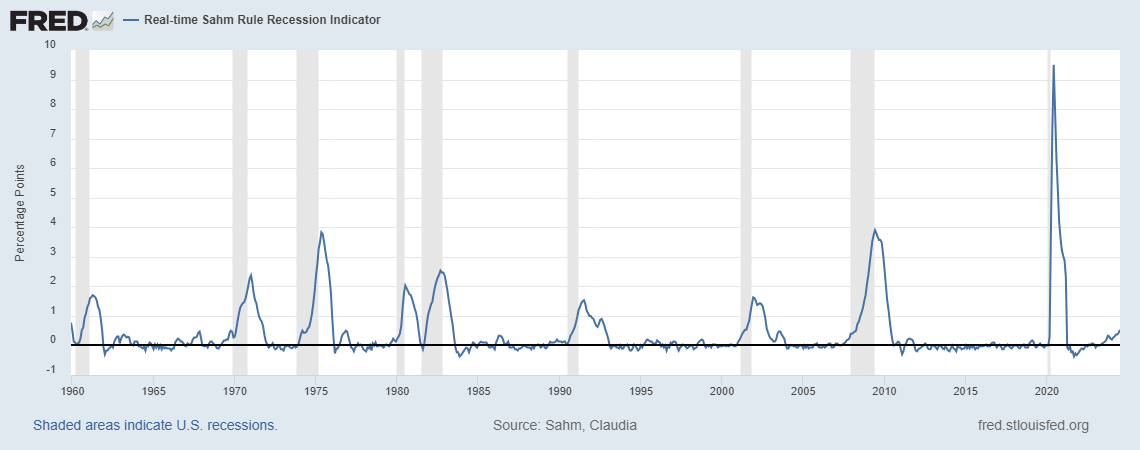
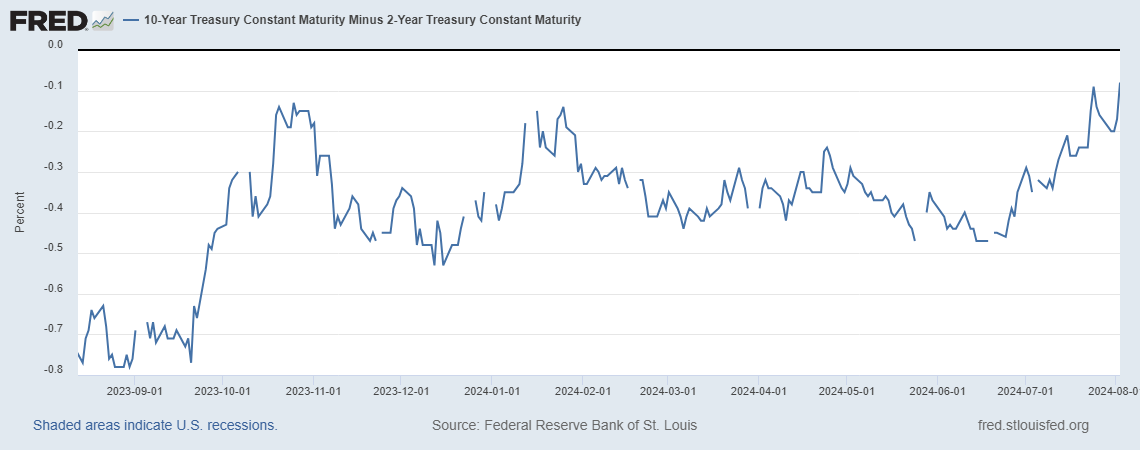
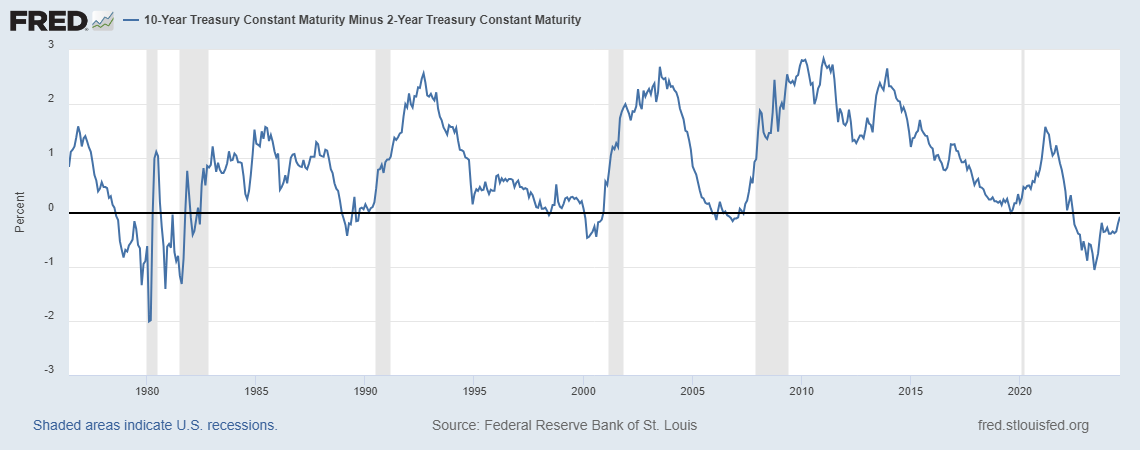
Meanwhile, the spread between the 10-year and 2-year Treasury yields narrowed further to -0.08. This movement indicates a further yield curve deinversion. Historically, recessions in the US have often followed the normalization of an inverted yield curve: These include the recession of 1990-1991, the burst of the dot-com bubble in 2001, the 2008 Financial Crisis, and the 2020 COVID-19 recession.
Fed’s dovish pivot and the aggressive market pricing of upcoming policy easing provided no support to steeply deteriorating sentiment. Fed held interest rates steady at 5.25-5.50%, with Chair Jerome Powell indicating that a rate cut in September is “on the table.” However, he stopped short of providing further guidance.
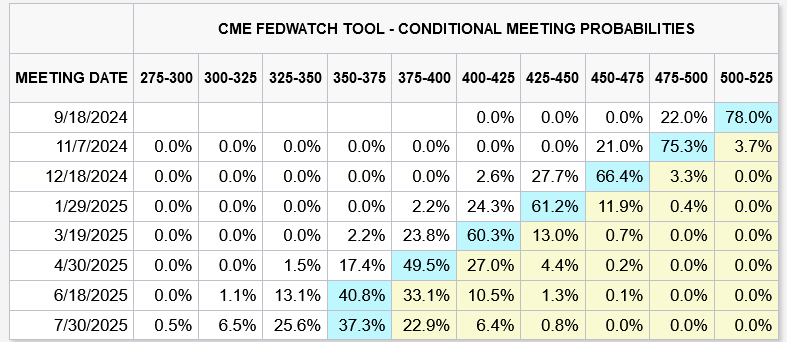
By week’s end, fed future indicated a 96.7% probability of a substantial 75 basis points rate cut by year’s end, bringing the target rate down to 4.50-4.75%. Moreover, there’s a growing speculation about even deeper cuts, with about a 30% likelihood of a total 100 basis points reduction this year. Notably, there is also a 22% chance of a significant 50 basis points cut in September.
Bearish Outlook for NASDAQ, S&P 500, 10-Year Yield, and Dollar Index
Technically, NASDAQ’s fall from 18671.06 extended lower last week after brief recovery. Further decline could be seen to 38.2% retracement of 12543.85 to 18671.06 at 16330.46. Some support could be seen there, at least on first attempt to bring recovery. But risk will stay on the downside as long as 17791.58 resistance holds
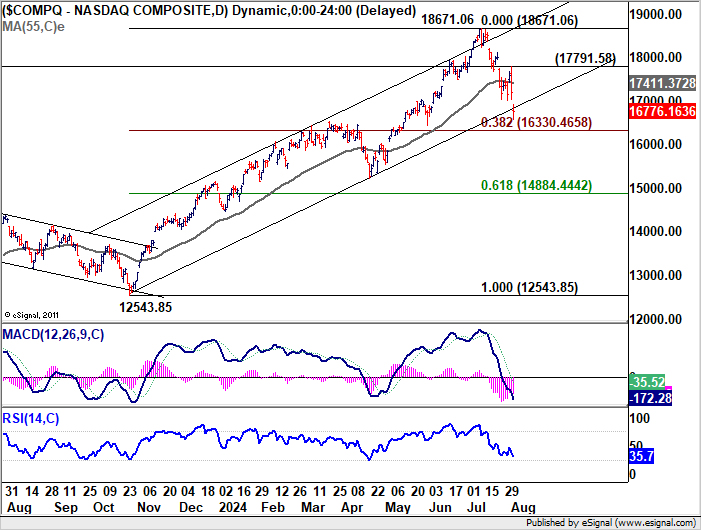
Sustained break of 16330.46 would argue that it’s probably correcting whole up trend from 10088.82 (2022 low) already. In this more bearish case. Further decline would be seen to 38.2% retracement of 10088.82 to 18671.06 at 15392.65, which is slightly below 55 W EMA (now at 15599.37).
S&P 500 also extended the fall from 5669.67 after brief recovery. Deeper decline is expected as long as 5566.16 resistance holds. Next target is 38.2% retracement of 4103.78 to 5669.67 at 5071.50.
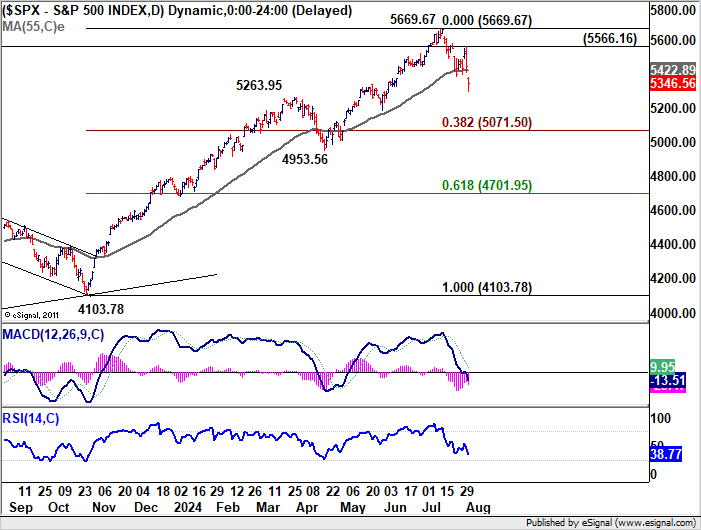
It’s still early to decide. But just in case that fall from 5669.56 is correcting the whole up trend from 3491.58 (2022 low), the decline could extend to 38.2% retracement of 3491.58 to 5669.67 at 4837.64, which is slightly above 55 W EMA (now at 4959.37.
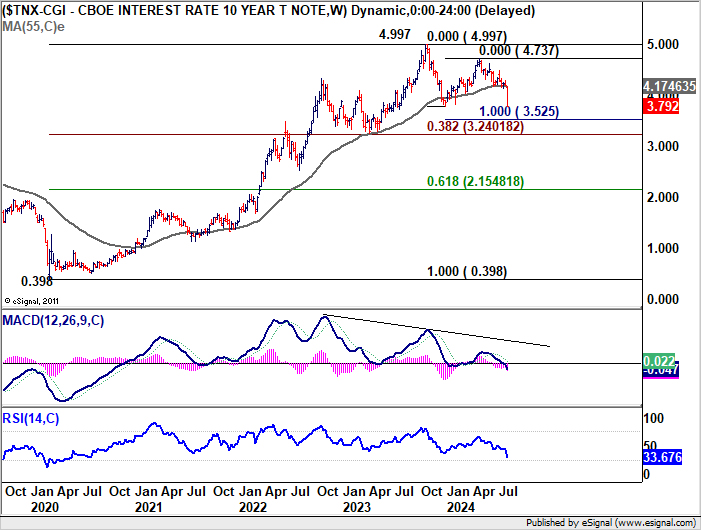
10-year yield’s fall from 4.737 accelerated sharply lower to close at 3.792 last week, sitting just inch above 3.785 support. Near term outlook will stay bearish as long as 4.144 support turned resistance holds. Break of 3.785 will target 100% projection of 4.997 to 3.785 from 4.737 at 3.525.
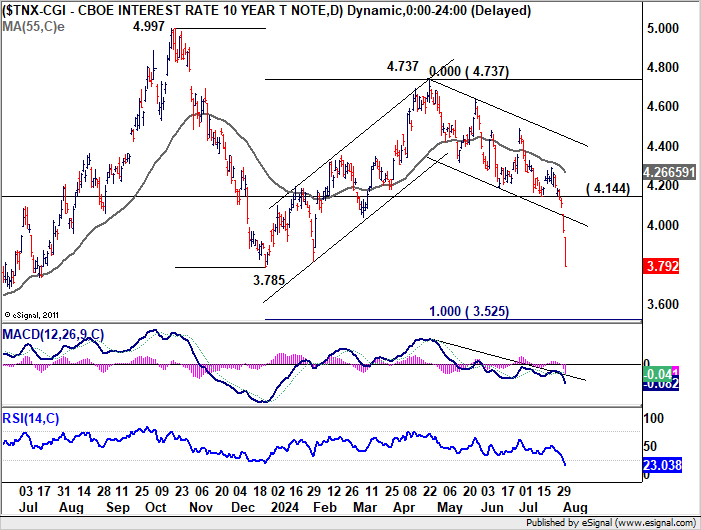
The strong break of 55 W EMA (now at 4.174) last week, as well as prior bearish divergence condition in W MACD, suggest that TNX is already correcting the up trend from 0.398 (2020 low). It’s likely that TNX will fall to 38.2% retracement of 0.398 to 4.997 at 3.240 before bottoming.
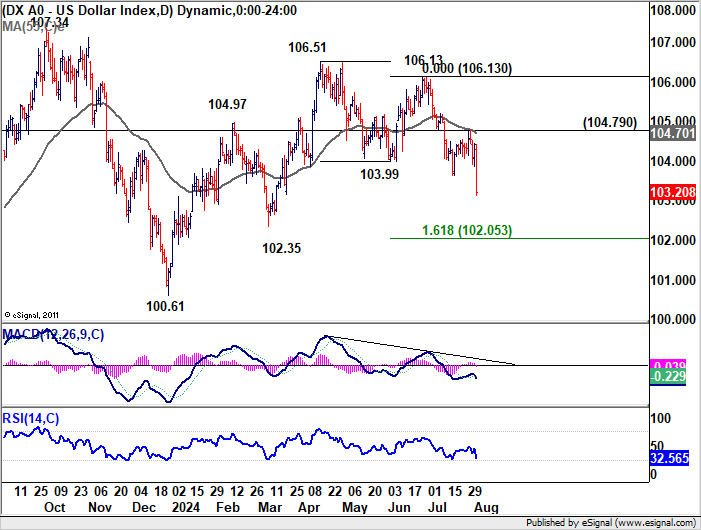
Dollar index’s steep decline last week is mainly attributed to the greenback’s selloff against Euro. To give it some context, ECB is generally expected to cut interest rate three times this year, once in June which it has already done, and twice more in September and then December. On the other hand, just around two months ago, Fed has indicated only one rate cut this year in its dot plot. Markets expectations have flip-flopped between one and two cuts. But now, the markets are seeing three cuts for sure, with possibility four rate cuts. That is, Fed could end up outdoing ECB on monetary easing this year.
Technically, prior rejection by 55 D EMA (now at 104.70) is a near term bearish sign for DXY. The strong break of flat 55 W EMA (now at 104.27) is a medium term bearish sign. For the short term, outlook will stay bearish as long as 104.79 resistance holds. Next target is 161.8% projection of 106.51 to 103.99 from 106.13 at 102.05.
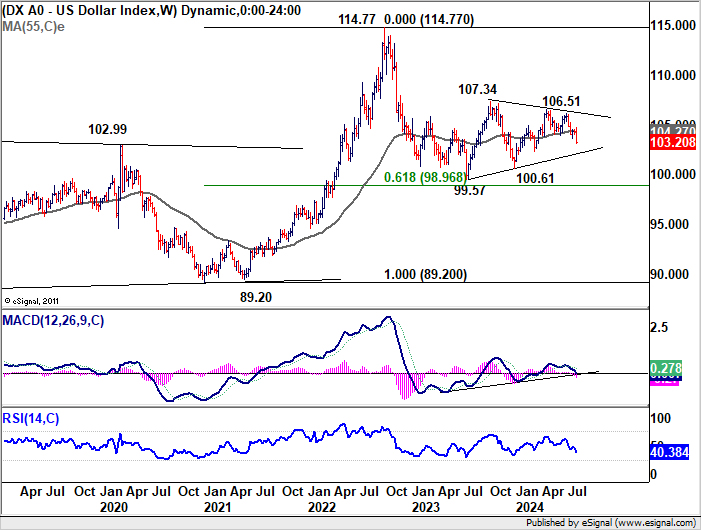
For the medium term, the decline from 106.51 is seen more as a down leg inside the sideway pattern from 99.57. So, there should be strong support between 99.57 and 100.61 to contain downside, even if the current fall is going to extend that deep. However, while it’s still early, any downside acceleration below 100.61 will raise the chance that DXY is indeed trying to resume the down trend from 114.77 (2022 high).
Yen and Swiss Franc Show Broad-Based Strength
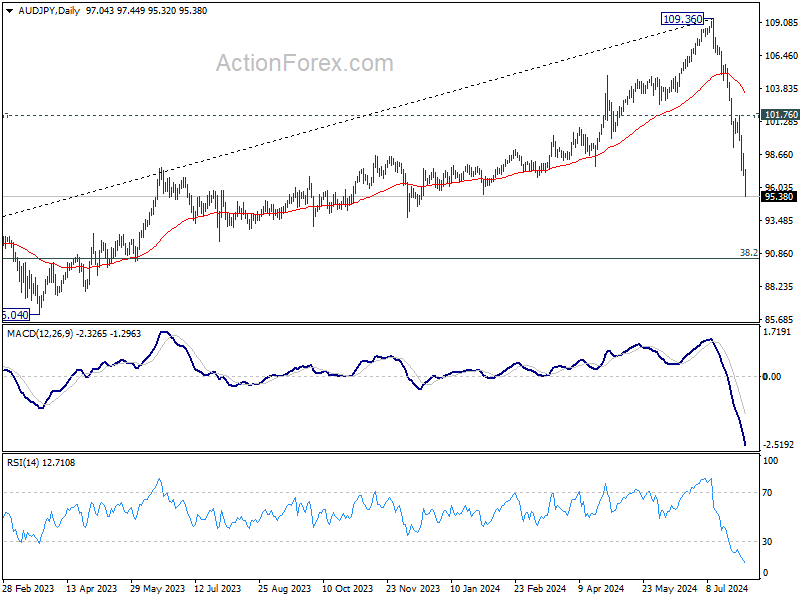
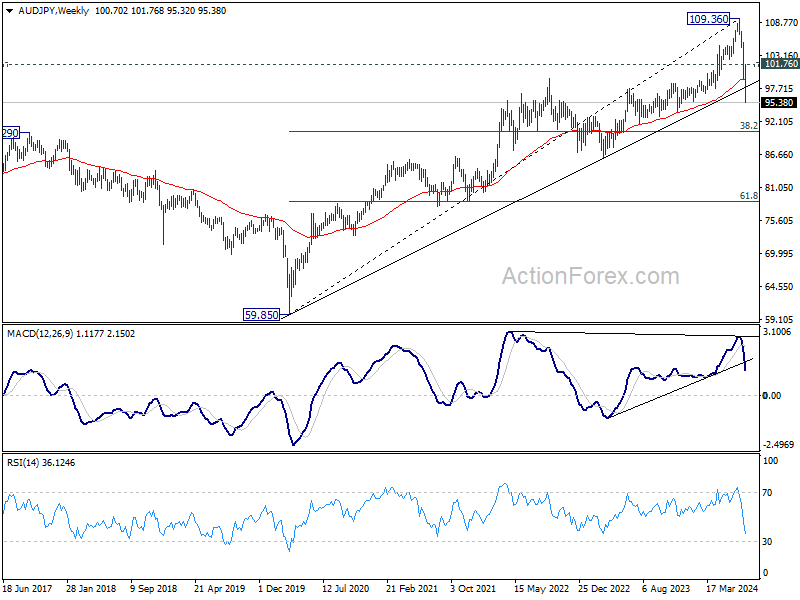
Elsewhere in the currency markets, Aussie was the worst performer, while Yen emerged as the best, making AUD/JPY one of the top movers. Australian investors found relief in Q2 CPI data showing moderation in core inflation measures, which eased pressure on RBA to hike interest rates at their upcoming meeting on August 6. This, coupled with broad risk aversion, especially in the Asia-Pacific region, put significant downward pressure on the Aussie.
Conversely, BoJ raised interest rates for the second time in the current cycle, increasing the overnight call rate to around 0.25%. Additionally, BoJ announced plans to reduce Japanese Government Bond purchases by JPY 400B each calendar quarter. Governor Kazuo Ueda emphasized that more tightening could be on the horizon if the economy evolves as expected and noted that 0.50% is not the ceiling for interest rates.
AUD/JPY’s strong break of 55 W EMA (now at 99.26) and long term trend line support should confirm that it’s already correcting whole up trend from 59.85 (2020 low). Near term outlook will stay bearish as long as 101.76 resistance holds, even in case of strong rebound. Next target is 38.2% retracement of 59.85 to 101.76 at 90.44.
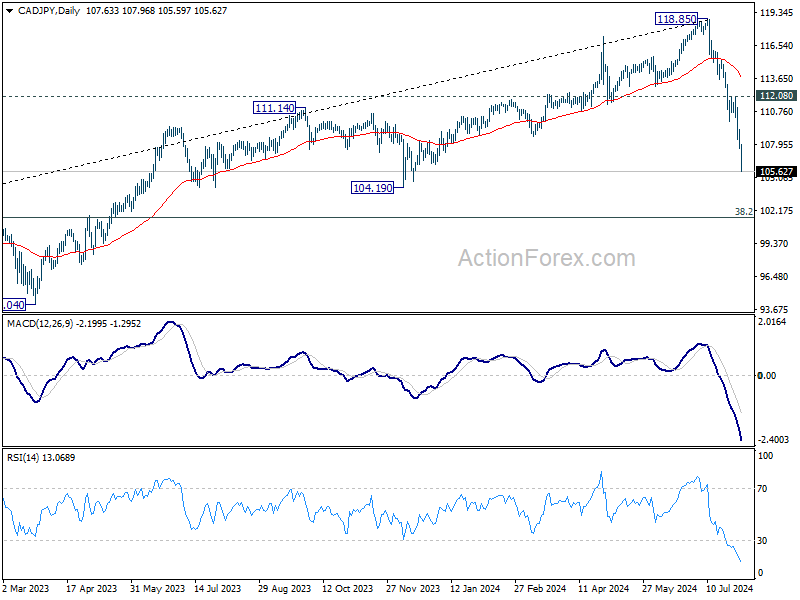
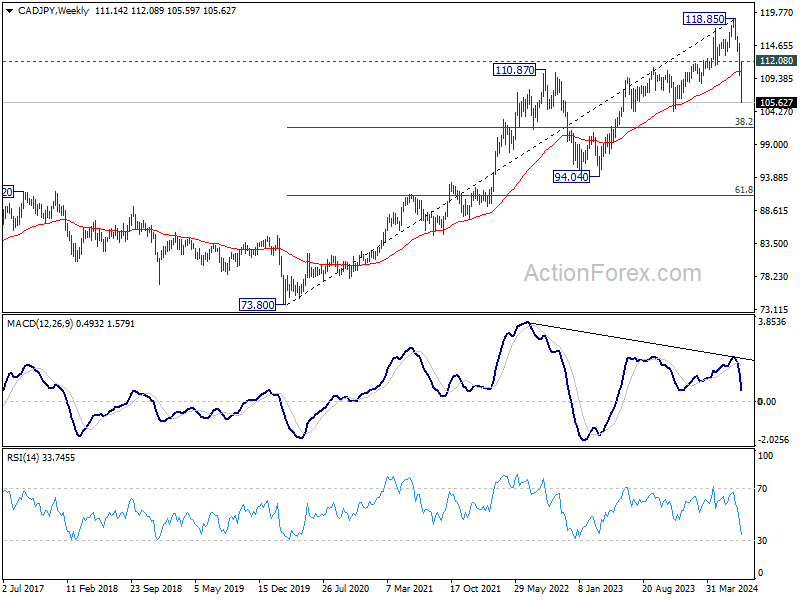
CAD/JPY also saw significant movement, as BoC is perceived as the most dovish among the G7 central banks, having already cut rates twice this year. Considering bearish divergence condition in W MACD, fall from 118.85 is probably correcting whole up trend from 73.80 (2020 low). Near term outlook will stay bearish as long as 112.08 resistance holds. Next target is 38.2% retracement of 73.80 to 118.85 at 101.64.
Sterling was also among the worst performers, facing pressures from multiple fronts. Although BoE rate cut was not particularly dovish, given the tight 5-4 vote split, it marked the start of a policy easing cycle. Governor Andrew Bailey’s cautious stance on inflation risks did little to buoy the Pound, which was also dragged down by broader risk-off sentiment.
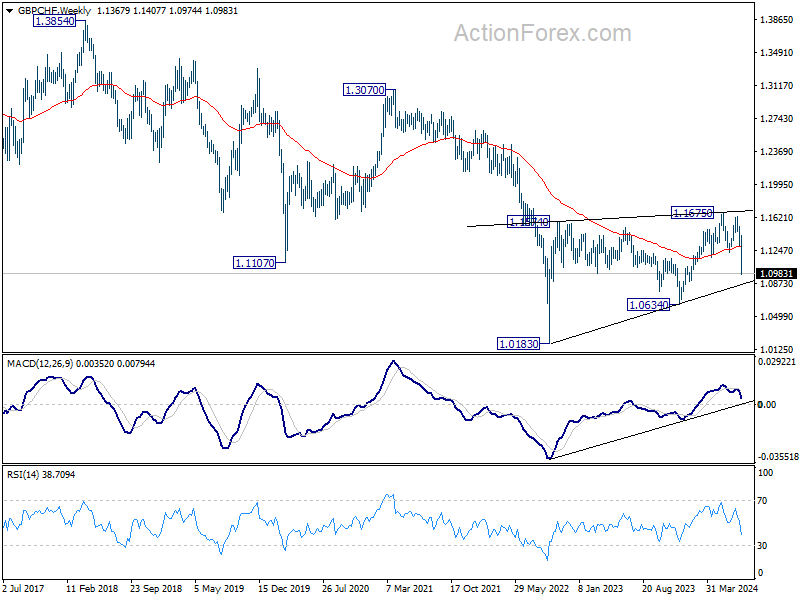
For GBP/CHF, fall from 1.1675 is reversing whole rise from 1.0634 at least. Near term outlook will stay bearish as long as 1.1216 support turned resistance holds. Next target is 161.8% projection of 1.1675 to 1.1216 from 1.1631 at 1.0888.
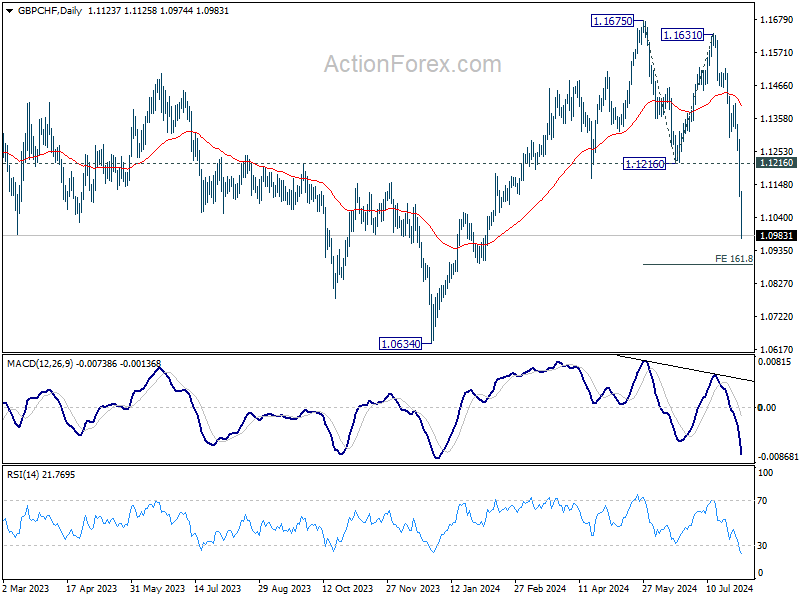
But more importantly, the whole corrective pattern from 1.0183 (2022 low) might have completed with three waves to 1.1675. If this view is correct, GBP/CHF should be ready to fall through 1.0634 support for a test on 1.0183 low at least.
EUR/CHF also tumbled sharply due to Swiss Franc’s broad based strength. Near term outlook will stay bearish as long as 0.9519 support turned resistance holds. Current fall from 0.9928 should target 100% projection of 0.9928 to 0.94767 from 0.9772 at 0.9320.
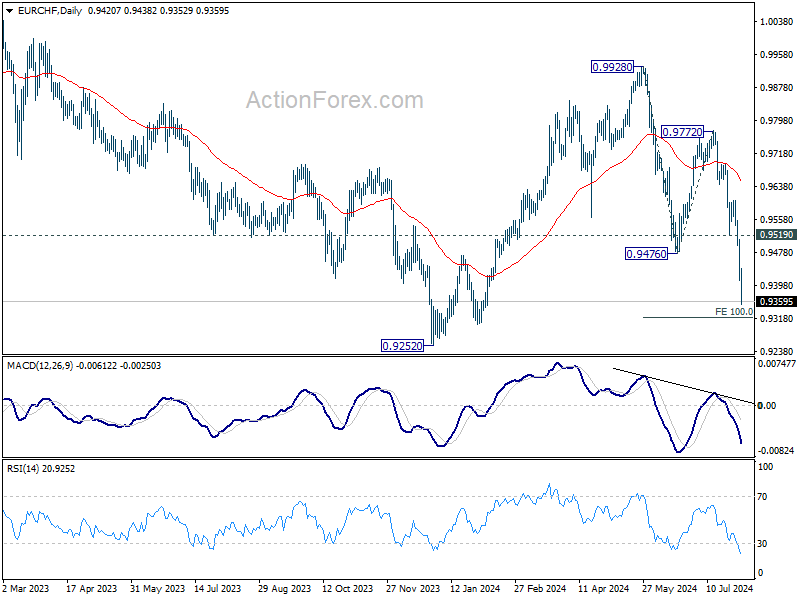
Decisive break of 0.9320, with further acceleration, would argue that EUR/CHF is indeed resuming the long term down trend. In this bearish case, next medium term target will be 61.8% projection of 1.1149 to 0.9407 from 0.9928 at 0.8851.
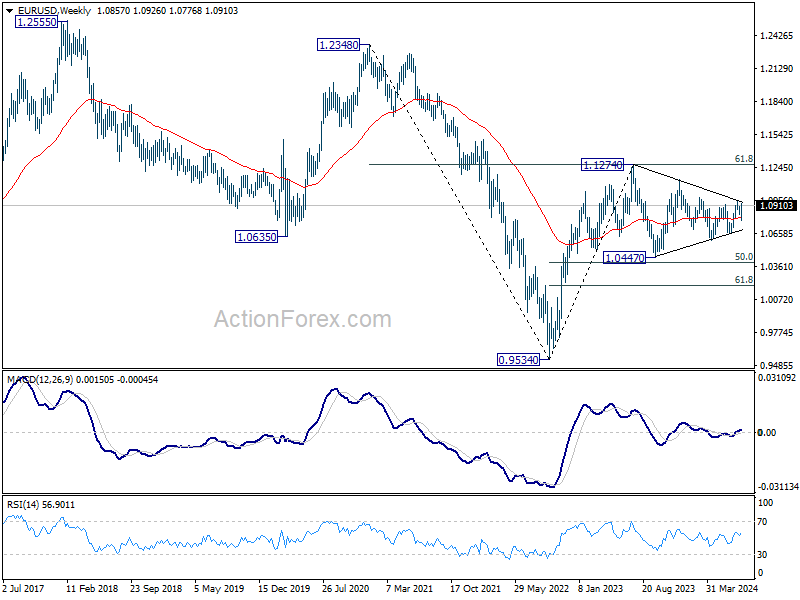
EUR/USD Weekly Outlook
While the dip to 1.0776 was deeper than expected, EUR/USD’s subsequent strong rebound suggests that pullback from 1.0947 has completed already. Initial bias stays on the upside for retesting 1.0947 first. Firm break there will target 100% projection of 1.0665 to 1.0947 from 1.0776 at 1.1056. For now, risk will stay on the upside as long as 55 4H EMA (now at 1.0839) holds, in case of retreat.

In the bigger picture, price actions from 1.1274 are viewed as a corrective pattern that’s still be in progress. Break of 1.1138 resistance will be the first signal that rise from 0.9534 (2022 low) is ready to resume through 1.1274 (2023 high). However, break of 1.0665 support will extend the correction with another falling leg back towards 1.0447 support.
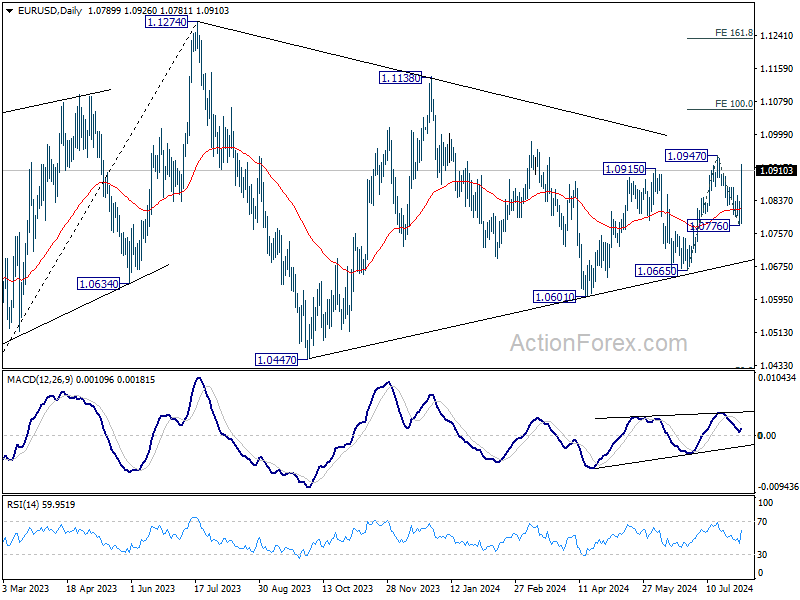
In the long term picture, a long term bottom is in place at 0.9534 (2022 low). Sustained break of 55 M EMA (now at 1.1011) will raise the chance of long term reversal. But even in this case, firm break of 1.2348 structural resistance is needed to confirm. Rejection by 55 M EMA will maintain bearishness for extend the down trend from 1.6039 (2008 high) through 0.9534 at a later stage.