weakened on Monday as it lagged behind the strengthening US Dollar ahead of the Federal Reserve's rate decision. This week, the CAD is underrepresented on the economic calendar, making it susceptible to broader market movements and central bank appearances. Key data to watch includes Wednesday’s Canadian GDP for May, anticipated to slow to 0.1% MoM from April’s 0.3%. Additionally, Thursday's S&P Global Canadian Manufacturing PMI for June is expected to remain in contraction territory, below 50.0, as it has since May 2023. These factors will likely influence CAD's performance this week.)
The Canadian Dollar (CAD) weakened on Monday as it lagged behind the strengthening US Dollar ahead of the Federal Reserve’s rate decision. This week, the CAD is underrepresented on the economic calendar, making it susceptible to broader market movements and central bank appearances. Key data to watch includes Wednesday’s Canadian GDP for May, anticipated to slow to 0.1% MoM from April’s 0.3%. Additionally, Thursday’s S&P Global Canadian Manufacturing PMI for June is expected to remain in contraction territory, below 50.0, as it has since May 2023. These factors will likely influence CAD’s performance this week.
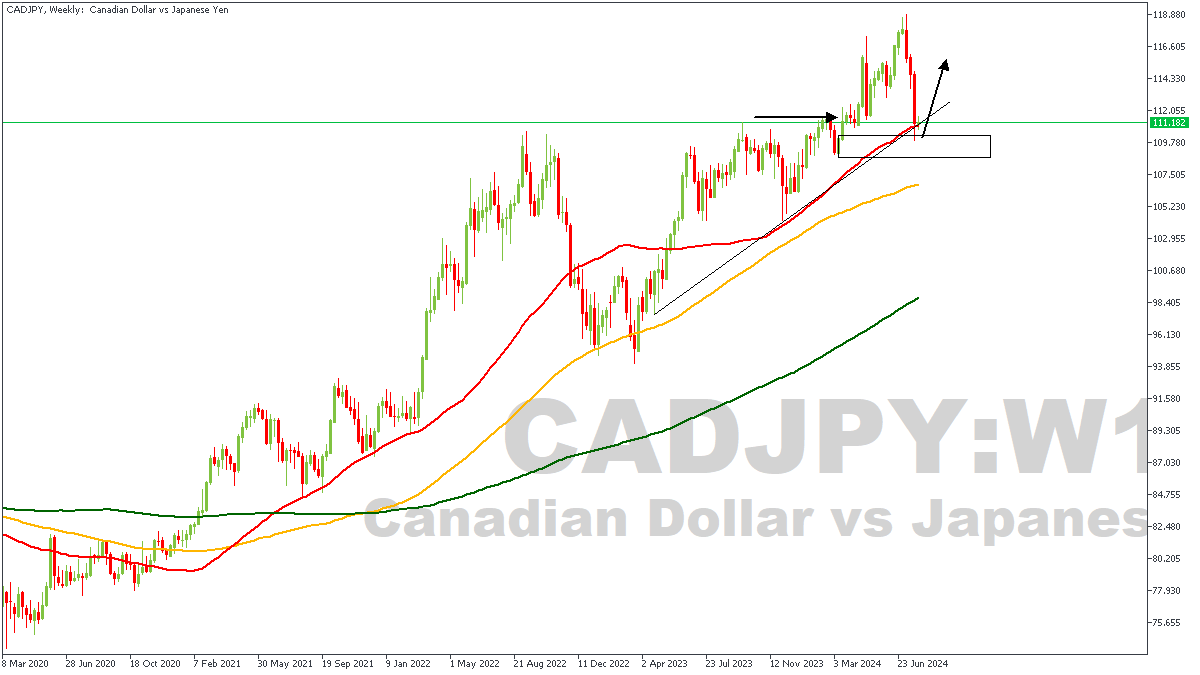
CADJPY – Weekly Timeframe
On the weekly timeframe of CADJPY, we see the price action is currently stalling around the 50-period moving average, while resting on a trendline support and a drop-base-rally demand zone. The bullish array of the moving averages can also be deduced clearly from the chart. Considering the break of structure at the highlighted horizontal arrow, I will be looking towards the lower timeframes for confirmation of a trade entry.
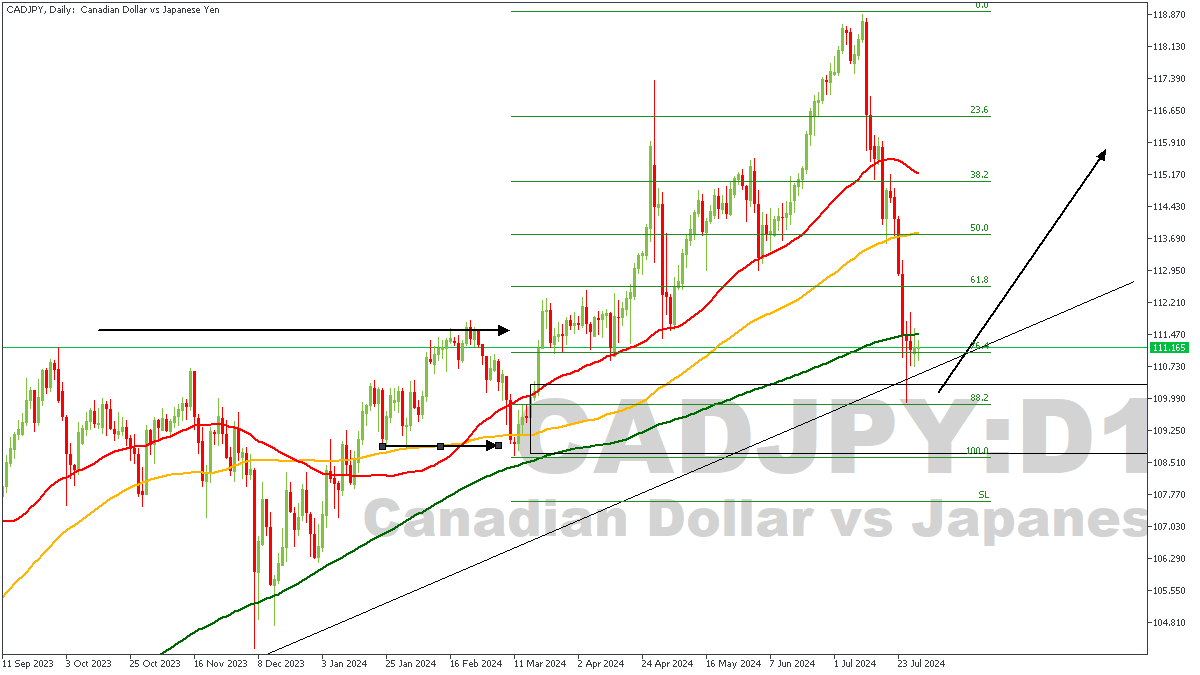
CADJPY – D1 Timeframe
One beautiful pattern I can spot pretty easily on this daily timeframe chart of CADJPY is the SBR (Sweep-Break-Retest) price action pattern. This is based on the sweep below the low at the short horizontal arrow, then the break above the high at the long horizontal arrow. Considering that the 200-day moving average is also in play as a crucial support level, as well as the trendline, simply implies that price can be expected to make a big bounce from the demand zone soon.
Analyst’s Expectations:
- Direction: Bullish
- Target: 114.501
- Invalidation: 108.463