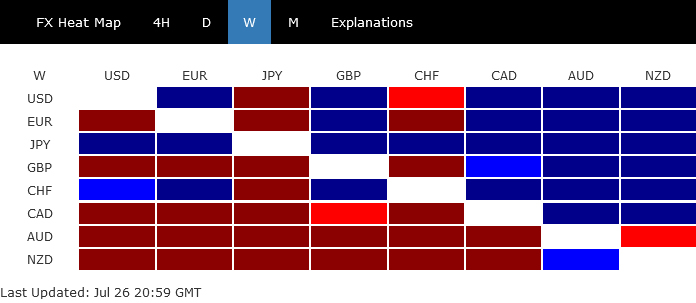
It was a highly volatile week which cannot be characterized by a single theme. Yen had a sharp and robust rally against all major currencies, continuing its rebound from the 38-year lows hit earlier this month, with market participants unwinding their long-held short positions. Alongside Yen, Swiss Franc and Dollar also emerged as winners, although they trailed significantly behind the Yen. Conversely, Australian Dollar took the bottom spot, followed by New Zealand Dollar and Canadian Dollar. These positions highlighted clear risk aversion sentiment.
The risk-off sentiment, however, was not uniformly reflected across all markets. In the US, while NASDAQ and S&P 500 had significant declines, DOW managed to post a weekly gain, with Russell 2000 also showing resilience. In Europe, FTSE and DAX ended the week higher, with the strong rebound on Friday, whereas CAC hit new lows for the year. In Asia, Japan’s Nikkei extended its plunge from record highs to hit the lowest level in three months, while China’s SSE resumed its downtrend .
Multiple themes are at play in the current market environment, creating a complex and even contradictory picture. Sector rotation within stocks is a notable trend. At the same time US election risk is also weighing on sentiment. Global monetary policy easing continues, with the notable exception of Japan. Meanwhile, economic slowdown in China is deepening, as evidenced by recent data and the government’s panic efforts to stimulate growth through rate cuts. However, amidst these diverse factors, the de-inversion of yield curve in the US stands out as a particularly significant development from a medium-term strategy perspective.
US Stocks End Week in Turmoil, Sector Rotation or More?
This week has been marked by turbulence in the US stock markets, driven by multiple conflicting themes. Despite a late-week rally, NASDAQ closed down -2.1%, while S&P 500 fell 0.8%. Both indexes experienced consecutive weekly losses for the first time since April. In contrast, DOW outperformed, rising 0.8% for its fourth straight positive week, a milestone not seen since May.
Sector rotation was evident, with Russell 2000 gaining nearly 4% for the week. However, it failed to surpass last week’s high of 2278.12, indicating that this rotation is more about minimizing losses than making significant gains. Similarly, DOW remained well below the previous week’s high of 41376.00.
Political uncertainty is also influencing investor behavior. With endorsements from President Joe Biden, former President Barack Obama, and former House Speaker Nancy Pelosi, Vice President Kamala Harris seems likely to secure the Democratic nomination to challenge Donald Trump in the upcoming presidential election. The shift in the Democratic candidate appears to have narrowed Trump’s lead notably, adding to the uncertainty.
On the data front, June PCE inflation data provided the Fed with further justification to consider easing monetary policy later in the year. Q2 GDP data presented a Goldilocks scenario, with stronger-than-expected growth while inflation pressures eased.
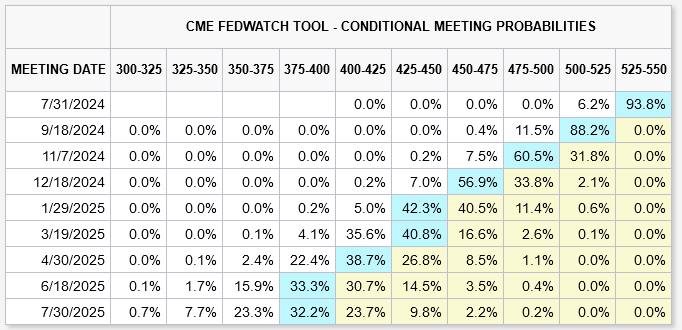
Fed funds futures indicate a fully priced-in 25bps rate cut in September. Markets also see a 68% chance of a second 25bps cut in November and a 64% chance of a third cut in December. If these cuts occur, federal funds rate would decrease to 4.50-4.75% by the end of the year, down from the current 5.25-5.50% level.
Yield Curve Steepening Signals Recession Risks
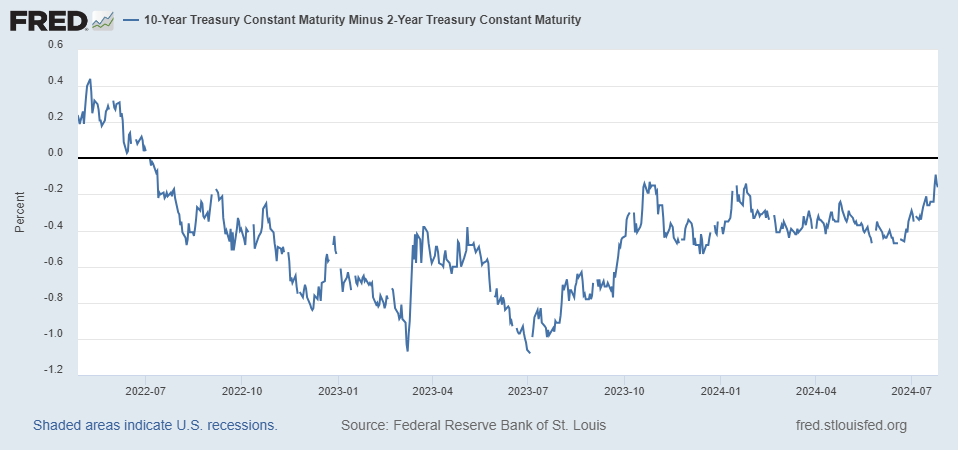
But above all, the most critical development in the background is steepening of the yield curve. Since mid-June, the spread between 10-year and 2-year Treasury yields has narrowed significantly, from -0.47 basis points to as little as -0.12 on Thursday, indicating a potential trend of normalization from inversion.
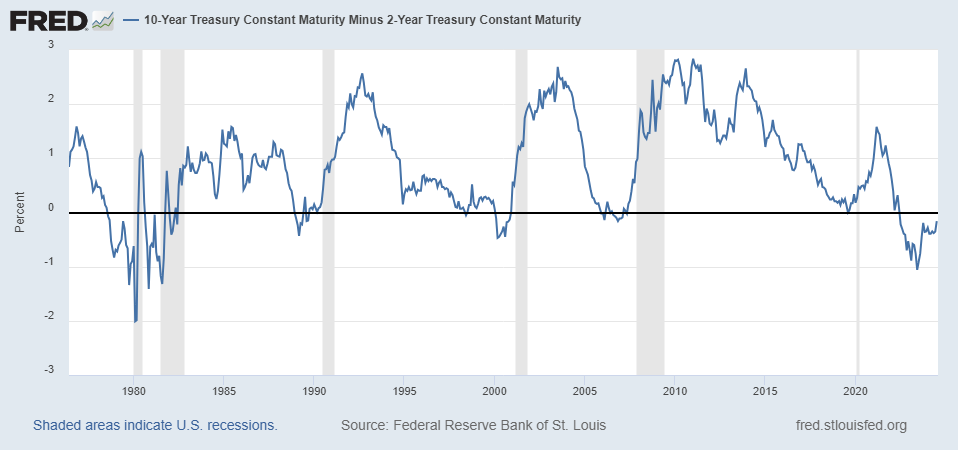
Historically, recessions in the US have often followed the normalization of an inverted yield curve:
- 1990-1991 Recession: The yield curve inverted in 1989 and normalized shortly before the recession began in July 1990.
- 2001 Recession: The yield curve inverted in 2000 and normalized just before the dot-com bubble burst, leading to a recession.
- 2008 Financial Crisis: The yield curve inverted in late 2006. Despite partial normalization in 2007, the US economy fell into a severe recession by December 2007, exacerbated by the housing market collapse and financial sector failures.
- 2020 COVID-19 Recession: The yield curve inverted in 2019 and normalized before the COVID-19 pandemic-induced recession in 2020, though this case was complicated by the pandemic’s unique impact.
As a side note, former New York Fed President William Dudley warned on Wednesday that Fed should cut interest rates immediately to stave off a recession, as current economic cooling measures are visibly effective.
Dudley highlighted that the three-month average unemployment rate has risen 0.43% from its low point over the past year, nearing the 0.5% threshold identified by the Sahm Rule, which has historically signaled a US recession.
Notably, once this threshold is breached, unemployment typically rises significantly more, with the smallest increase being nearly 2% from trough to peak.
NASDAQ’s Downside Risks Materialize While DOW Retains Bullish Outlook
Technically, NASDAQ’s steep decline last week and break of 55 D EMA (now at 17451.72) suggests that fall from 18671.06 is at least correcting the rally from 12543.85. Risk will stay on the downside as long as 18128.38 resistance holds. Deeper fall would be seen to 38.2% retracement of 12543.85 to 18671.06 at 16330.46 before finding strong support to set the range for consolidations.
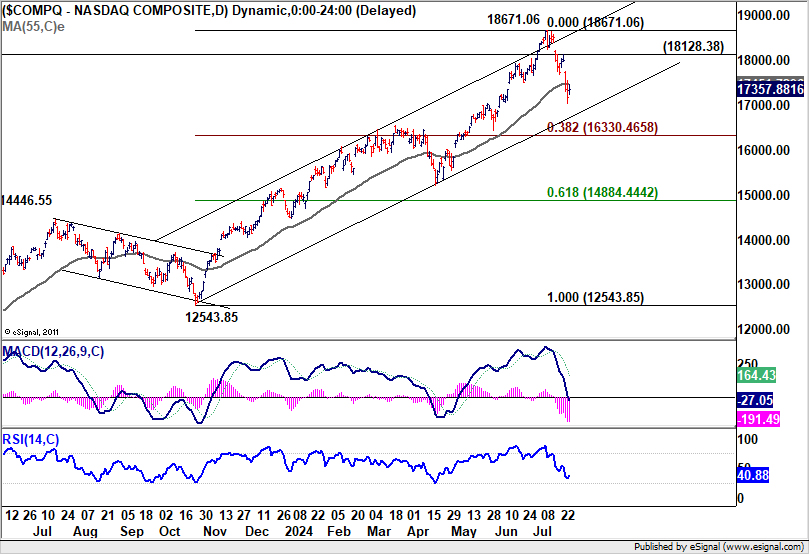
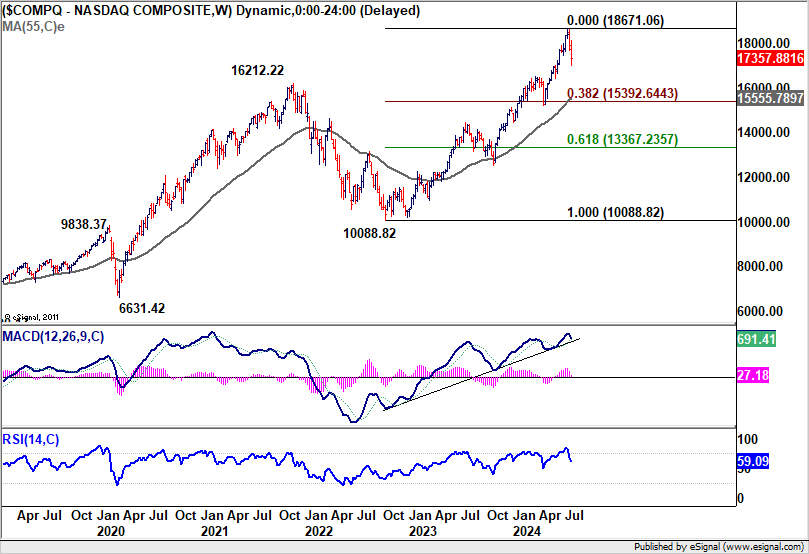
While it’s still early to call, firm break of 16330.46 will raise the chance that NASDAQ is indeed correcting the whole up trend from 10088.82 (2022 low). In this more bearish case, enough support could only be found between 38.2% retracement of 10088.82 to 18671.06 at 15392.65, and 55 W EMA (now at 15555.78).
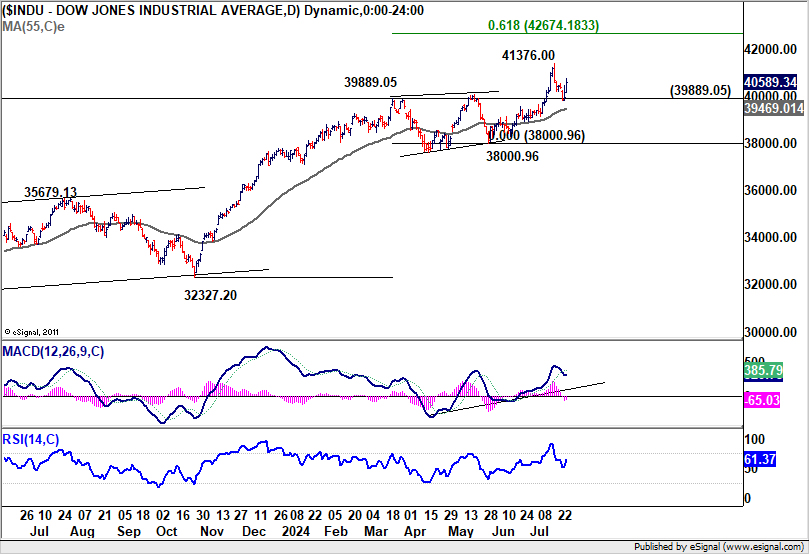
Conversely, DOW’s strong bounce from 39889.05 resistance turned support is keeping near term bullishness intact. Another rise could be seen through 41376.00 to 61.8% projection of 32327.20 to 39889.05 from 38000.96 at 42674.18. However, decisive break of 39889.05 would open up deeper fall to 38000.96 support as larger scale correction.
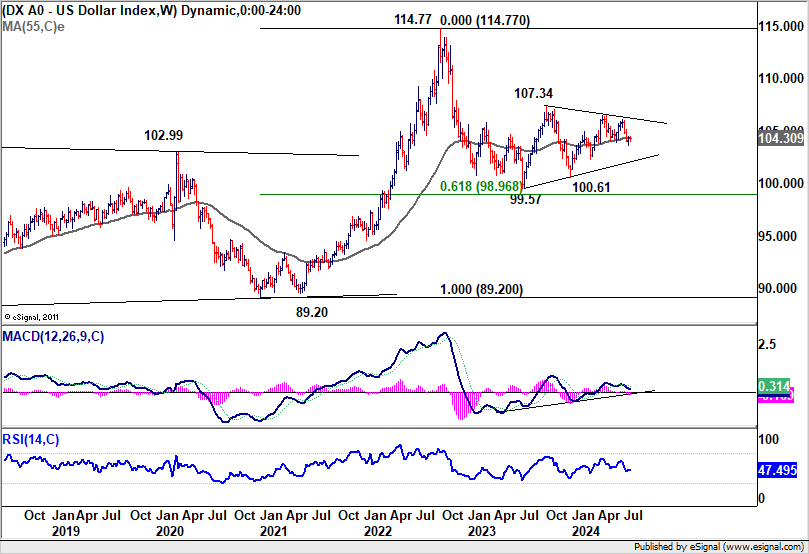
Dollar Index’s movements have been mixed as it struggled to find a clear direction, on whether the market is risk-on, or risk off. The index is also struggling around 55 W EMA (now at 104.30). Risk will stay on the downside as long as 105.20 resistance holds. Firm break of 103.65 and sustained trading below 55 W EMA will bring deeper fall to 102.35 or even further to 100.61.
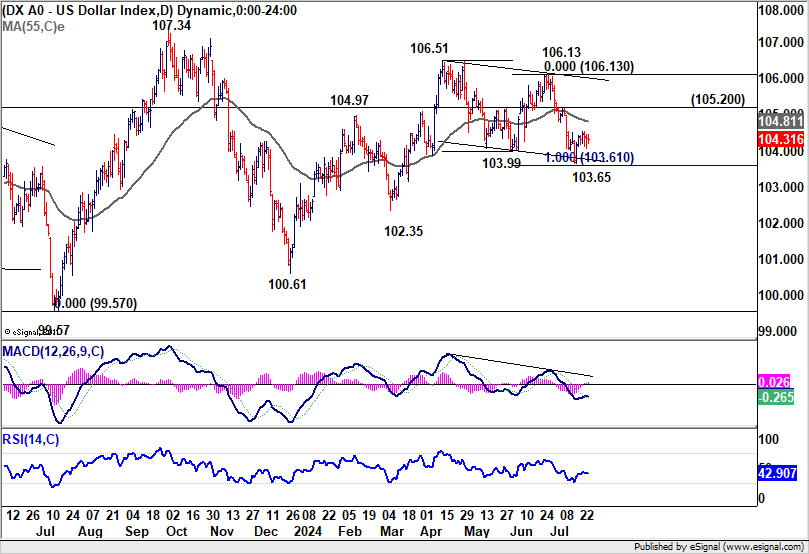
However, break of 105.20 will argue that price actions from 106.51 is merely a corrective pattern that has completed with three waves to 103.65. Dollar index should then be ready to rise through 106.13/51 resistance zone to resume the rebound from 100.61.
Chinese Investor Sentiment Deteriorates Amid Panic-Driven Rate Cuts
Another development to note is the continued deterioration in investor sentiment in China, driven by what appears to be panic measures from the People’s Bank of China to bolster an economy growing at its slowest pace in more than a year.
On Thursday, PBoC made a surprise, off-schedule cut to its one-year medium-term lending facility rate, lowering it from 2.5% to 2.3%. This move injected CNY 200B of liquidity into the market and marked the largest reduction since 2020. Earlier in the week, PBoC announced its first cut in nearly a year to a key short-term policy rate, reducing the seven-day reverse repo rate from 1.8% to 1.7%.
These aggressive rate cuts have underlined the authorities’ urgency and contributed to a sense of panic rather than lifting market sentiment.
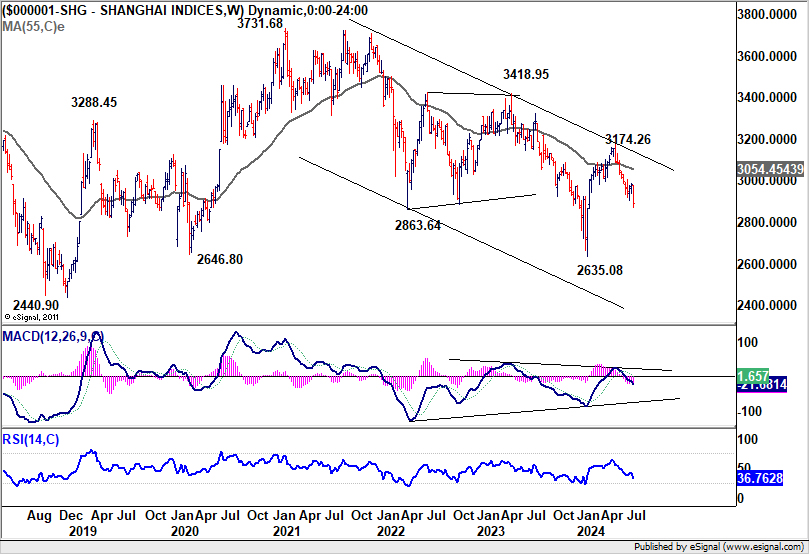
Shanghai SSE Composite resumed the fall from 3174.26 to close at 2890.89, lowest in February. Technically, near term focus is now on 61.8% retracement of 2635.08 to 3174.26 at 2841.04. Strong bounce from this level, followed by break of 2986.24 resistance, will suggest that fall from 3174.26 is probably just a corrective move, and has possibly completed.
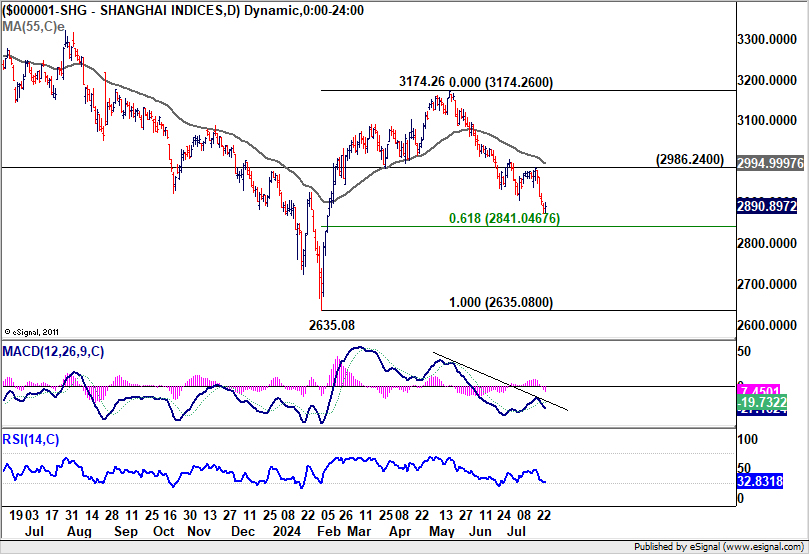
However, sustained break of 2841.04 would risk deeper sell-off back to 2635.08. More importantly, This will raise the chance that SSE is indeed trying to resume whole down trend from 3731.68 (2020 high), as its rebound attempt has been repeatedly rejected by falling 55 W EMA.
AUD/JPY and NZD/JPY Plunge Amid Broad Yen Rally and Regional Risk-Off Sentiment
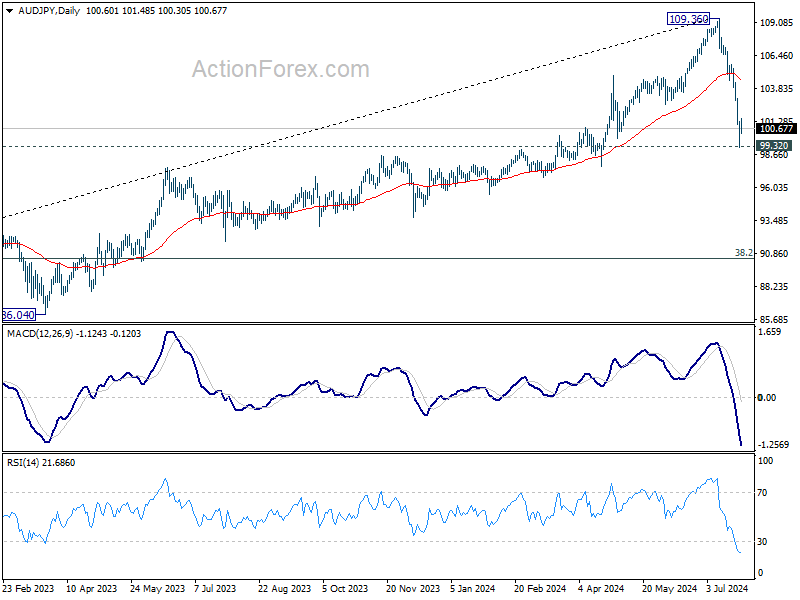
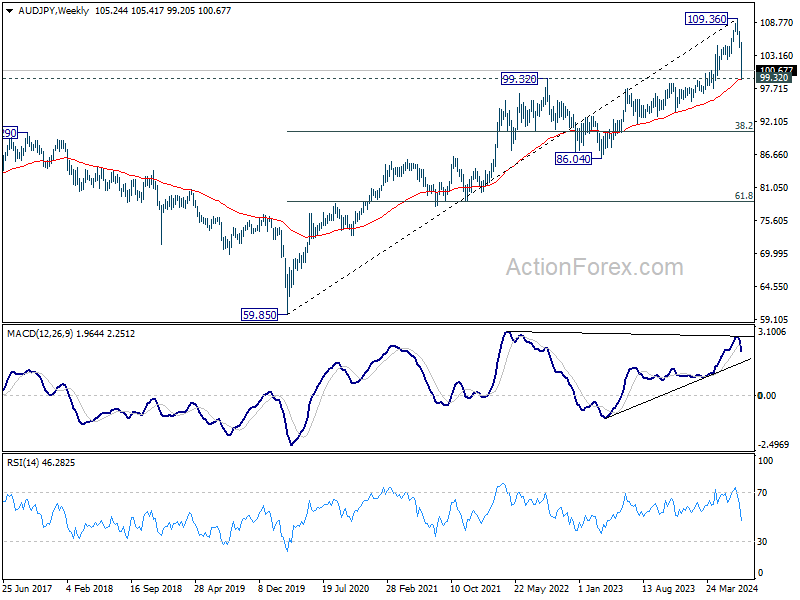
AUD/JPY and NZD/JPY were the biggest movers last week, both lost more than -4.5%. The strong, broad-based rally in Yen was certainly a factor. The strong, broad-based rally in the Yen played a major role in this decline, compounded by a prevailing risk-off sentiment in both China and Japan.
Technically, AUD/JPY is now pressing an important cluster support zone, including 99.32 resistance turned support and 55 W EMA (now at 99.26). Some stabilization could be seen from current level to bring rebound. Yet, risk will continue to stay heavily on the downside as long as 55 D EMA (now at 104.66) holds. Sustained break of 99.32 will argue that AUD/JPY is at least correcting the whole rise from 59.85 (2020 low), with risk of bearish reversal. Deeper fall would then be seen to 38.2% retracement of 59.85 to 109.36 at 90.44.
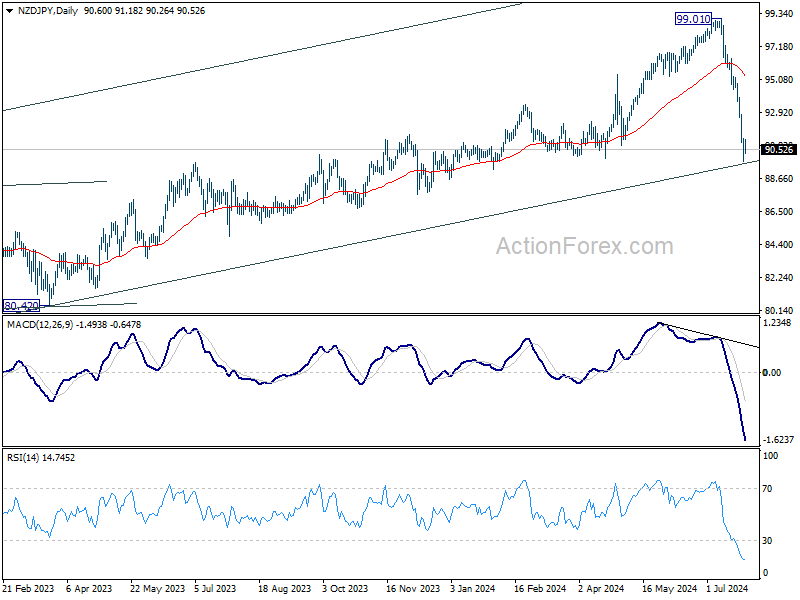
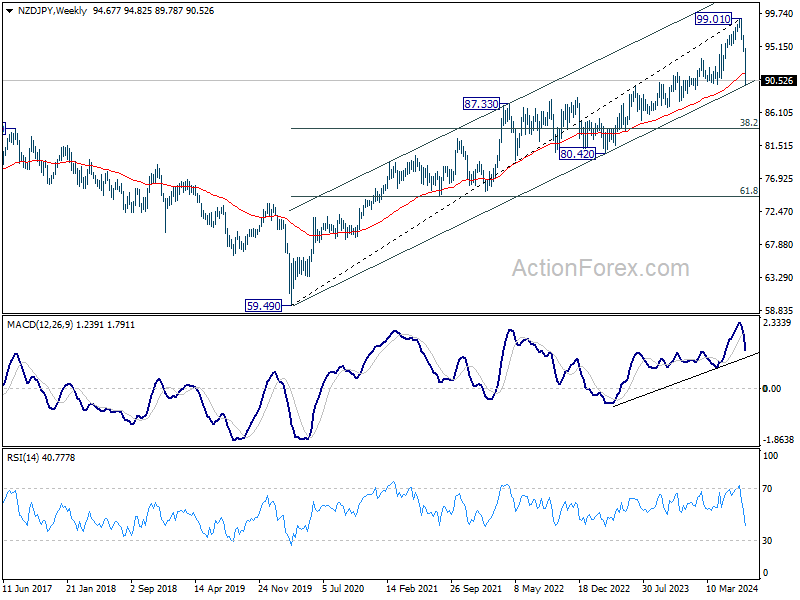
NZD/JPY has broken 55 W EMA already, and it’s now trying to draw support from long term channel. Some stabilization could be seen from current level to bring rebound. Still, risk will stay on heavily on the downside as long as 55 D EMA (now at 95.27) holds. Sustained break of the channel support will indicate that it’s at least correcting the whole up trend from 59.49 (2020 low) with risk of bearish reversal. Deeper fall would then be seen to 38.2% retracement of 59.49 to 99.01 at 82.389.
EUR/CHF Weekly Outlook
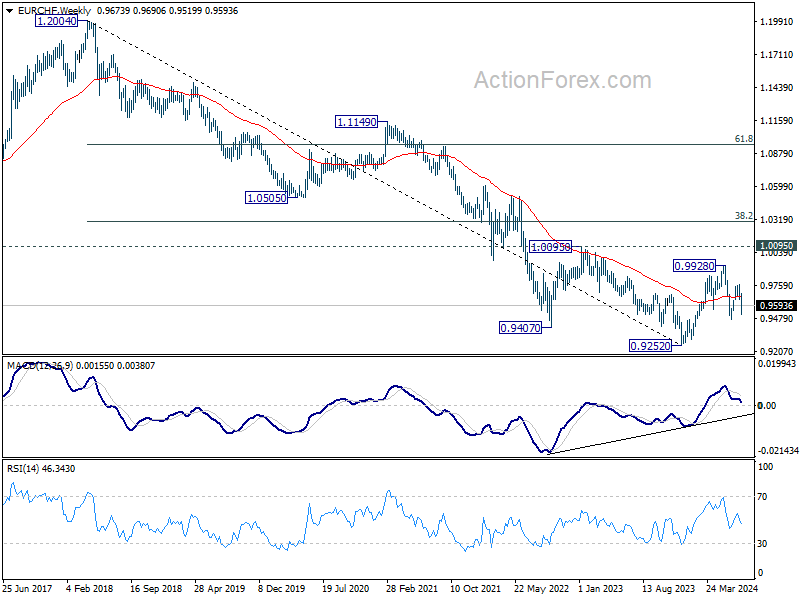
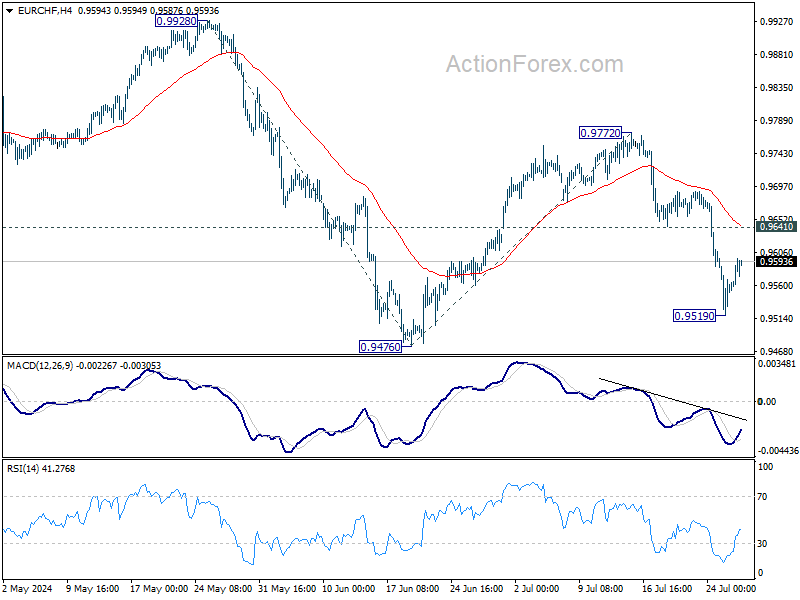
EUR/CHF’s fall from 0.9772 extended to 0.9519 last week but recovered since then. Initial bias is turned neutral this week for consolidations first. Further decline is expected as long as 0.9641 support turned resistance holds. Rebound from 0.9476 should have completed as a corrective move at 0.9772. Below 0.9519 will bring retest of 0.9476. Firm break there will resume whole fall from 0.9928 to 100% projection of 0.9928 to 0.94767 from 0.9772 at 0.9320.
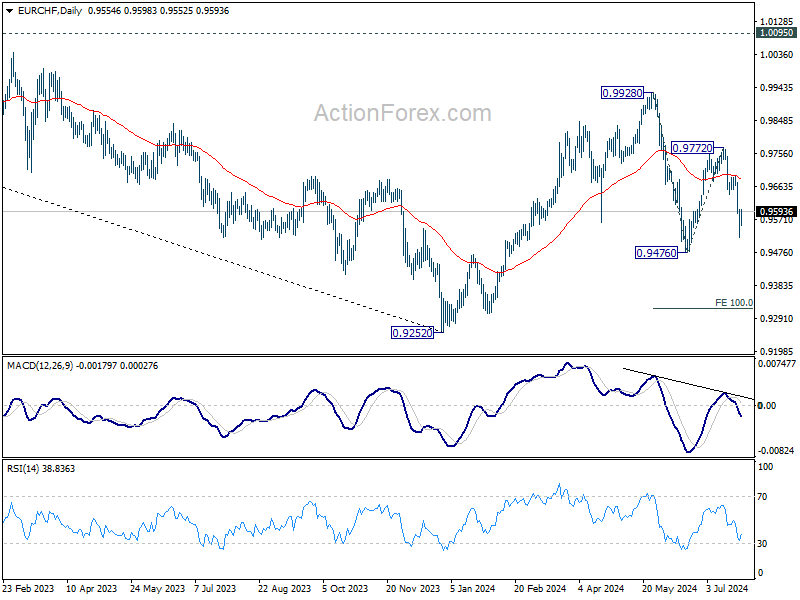
In the bigger picture, with 1.0095 key medium term resistance intact, price actions from 0.9252 (2023 low) are seen as a corrective pattern. Fall from 0.9928 might be the second leg and break of 0.9476 would bring deeper decline to retest 0.9252 low. But strong support should be seen there to extend the corrective pattern with another rising leg. In any case, medium term outlook will be neutral at best as long as 1.0095 structural resistance holds.
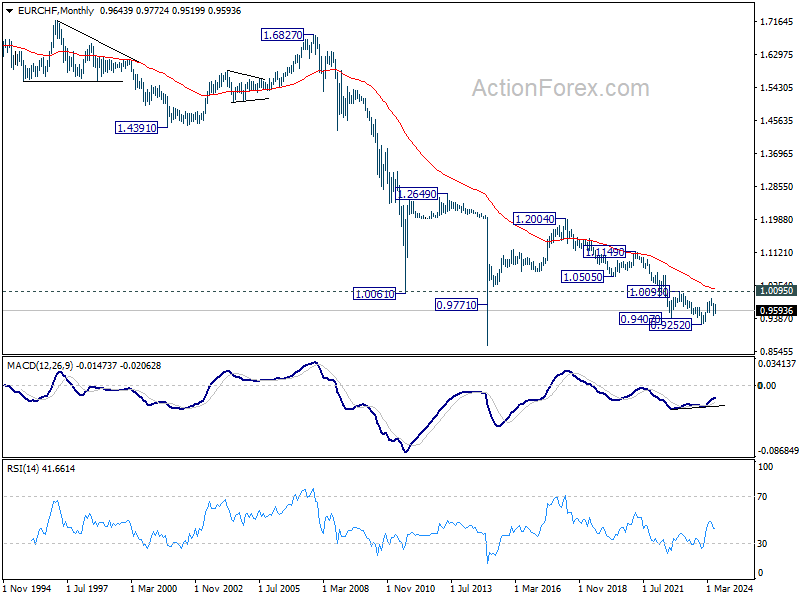
In the long term picture, fall from 1.2004 (2018 high) is part of the multi-decade down trend. Firm break of 1.0095 resistance is needed to be the first sign of long term bottoming. Otherwise, outlook will remain bearish.