
 may have reached a bearish exhaustion inflection level at the US$2,353 short-term pivotal support (also the 50-day moving average).)
- The recent weakness seen in Gold (XAU/USD) is likely to be driven by US politics as the “Gold premium” has moved in synch with the betting odds of Republican nominee Trump winning the US Presidential Election.
- The US Treasury market is likely to take a driver’s seat now as the focus returns to the monetary policy guidance from the outcome of the US Fed FOMC meeting next Wednesday, 31 July.
- The 10-year US Treasury real yield has staged a bearish reaction below its 2.00%/2.07% key intermediate resistance that may support higher Gold (XAU/USD) prices.
Since our last publication, the price actions of Gold (XAU/USD) have shaped the expected push-up to print another fresh all-time intraday high of US$2,484 on Wednesday, 17 July.
After that, Gold (XAU/USD) slipped by 5.26% to print an intraday low of US$2,353 on Thursday, 25 July. The recent weakness in the Gold is likely to be driven by the US Presidential Election fiasco where US President Biden dropped out of the race and nominated Vice President Harris as the Democrat presidential nominee with the support from most prominent Democrats to face off against the Republican presidential nominee Donald Trump.
The recent “Gold premium” has moved in synch with the betting odds of Trump winning the ticket to the White House in the past two weeks as Trump’s odds steadily increased and hit a recent peak on 15 July before it slipped. Interestingly, that was two days before Gold (XAU/USD) hit its US$2,484 current fresh all-time high on 17 July.
According to data from RealClear Politics, the average betting odds for Trump have slipped from a high of 66% on 15 July to 55% at this time of the writing. In contrast, the odds of the unofficial Democrat presidential nominee Harris have risen to 36% from 7% over the same period; indicating that the betting market thinks Harris is likely to be a tougher challenger for Trump, in turn, reduces the odds of Trumponomics 2.0 in November.
This direct correlation of Gold (XAU/USD) with Trump winning the US Presidential Election has been driven by his preferred fiscal policies of steep corporate tax cuts (a part of Trumponomics) which in turn is likely to widen the US budget deficit that faces the risk of another round of credit downgrade on US Treasuries by rating agencies. Hence, that’s a positive for Gold (XAU/USD), acting as a hedge in times of fiscal dominance that may lead market participants to question the credit standing and solvency of the US government.
Right now, given that the outcome of the US Federal Reserve monetary policy meeting is around the corner next Wednesday, 31 July, the focus will return to the US Treasury market (US politics taking a beat seat till October) which will be likely influenced by the latest monetary policy stance of the US Fed that can impact the prices of Gold (XAU/USD) in the next two weeks via the “opportunity cost” factor.
10-year US Treasury real yield remains below 2.00%
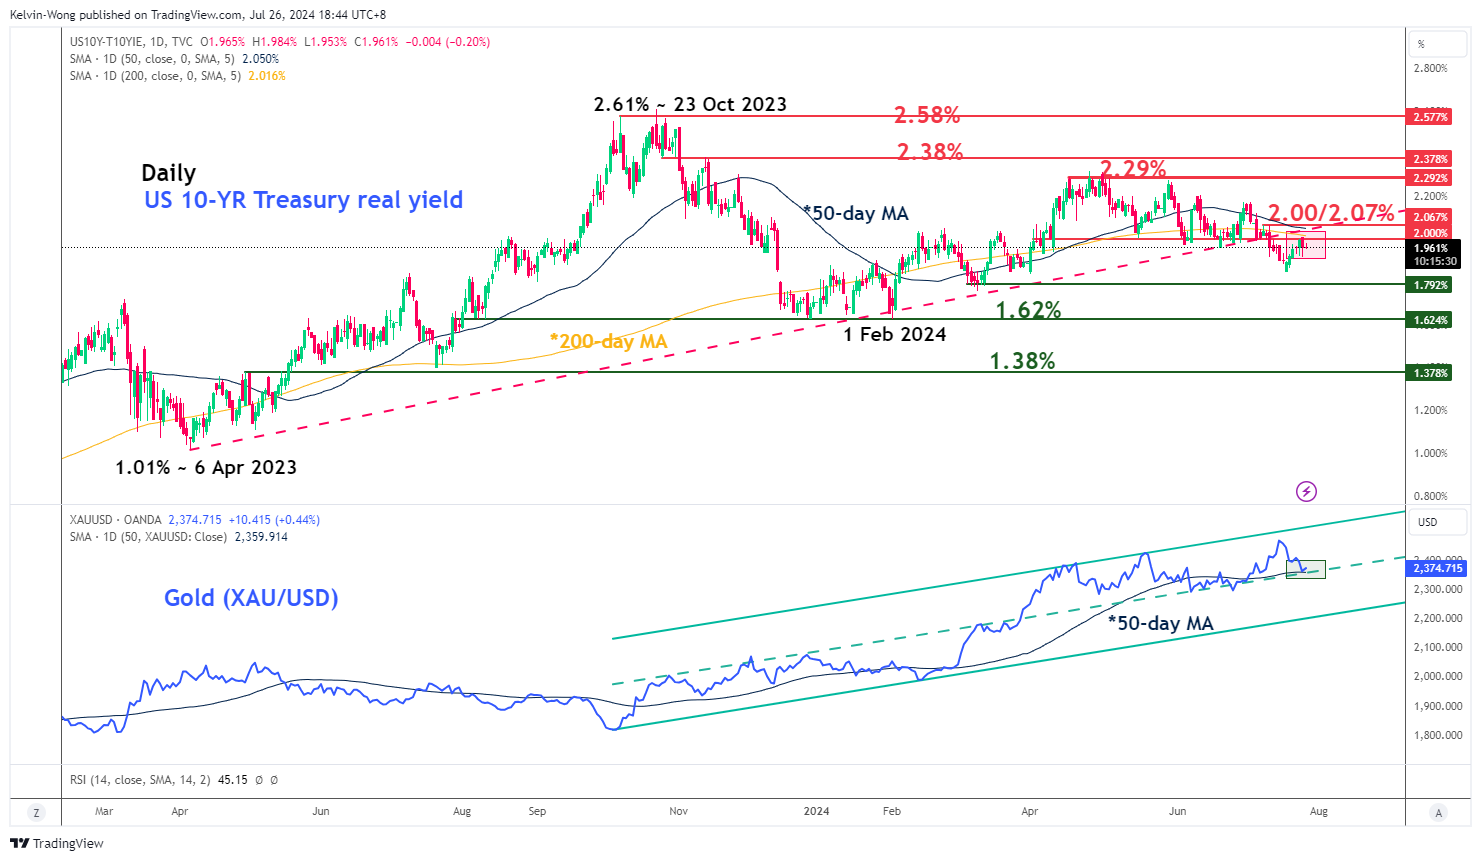
Fig 1: US 10-YR Treasury real yield major & medium-term trends as of 26 Jul 2024 (Source: TradingView, click to enlarge chart)
Based on the latest data from the CME FedWatch tool at this time of the writing, the Fed Funds rate futures market has priced in a high odd (89% chance) that the Fed is likely to enact its first interest rate cut of 25 bps on the 18 September FOMC follow by two more cuts of 25 bps each in November (76% chance) and December (66% chance) meetings.
Hence, market participants are now anticipating the start of an interest rate cut cycle rather than the Fed keeping interest rates at a higher level for an extended period. The odds of an interest rate cut cycle kicking off in the US in the near-term horizon are likely to increase if today’s core PCE inflation data for June comes in within or below expectations of 2.5% y/y, a dip from 2.6% y/y in May which indicates a clear path of deceleration in US inflationary trend.
Interestingly, the US Treasury market has painted a potential softer US inflationary trend picture ahead of the US PCE data release. The 10-year US Treasury real yield has shaped a bearish reaction right below a key intermediate resistance zone of 2.00%/2.07% that also confluences with the 50-day and 200-day moving averages that capped price actions since 11 July.
Yesterday’s dip in the 10-year US Treasury real yield has caused the recent price drop in Gold (XAU/USD) to stabilize right at its 50-day moving average and the median line of the medium-term ascending channel in place since the October 2023 low (see Fig 1).
Watch the US$2,386 potential upside trigger level for Gold
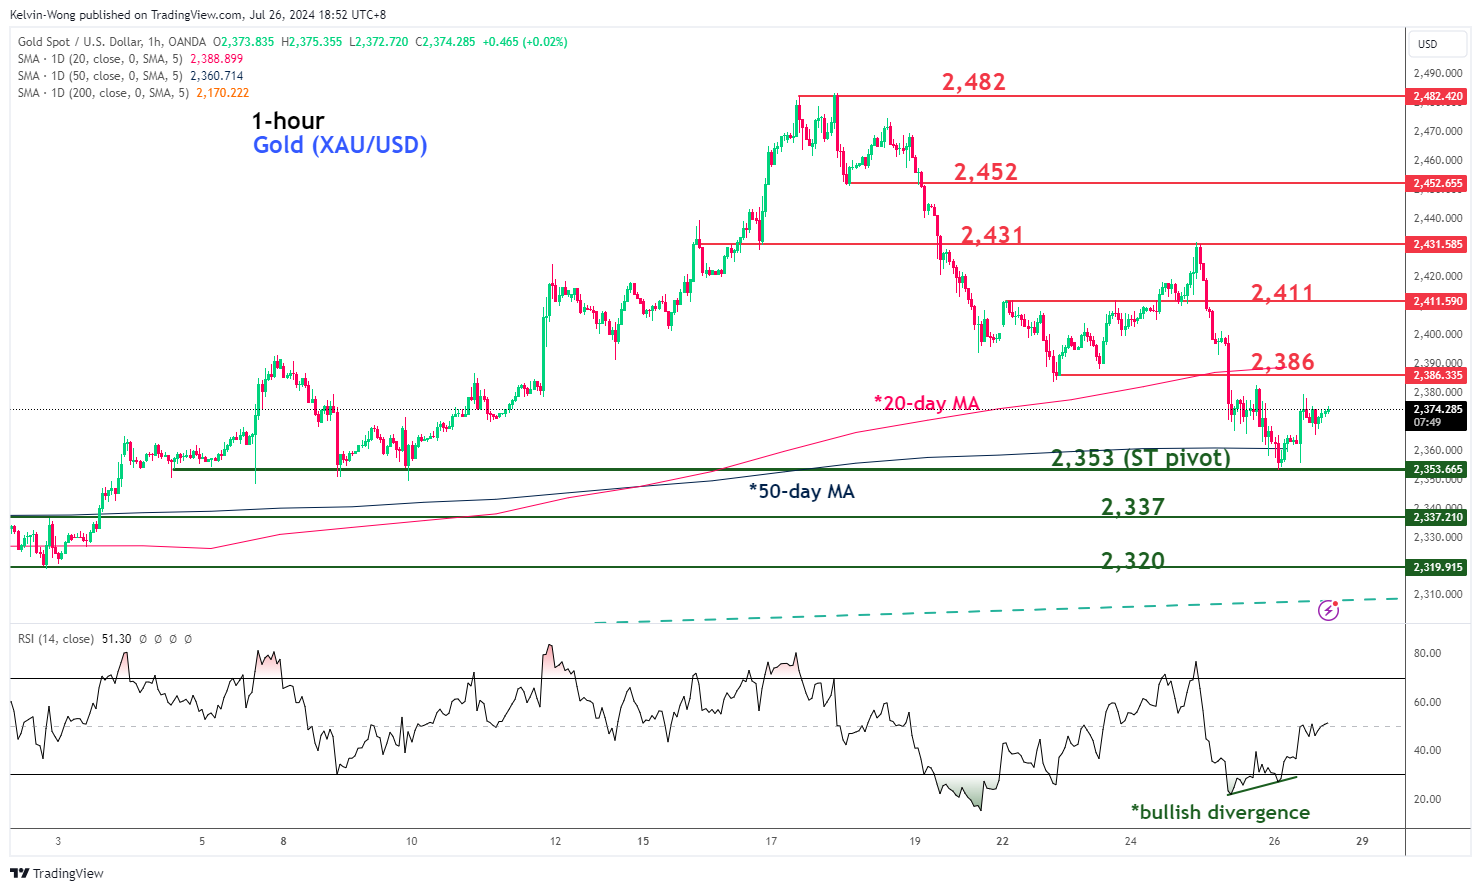
Fig 2: Gold (XAU/USD) short-term trend as of 26 Jul 2024 (Source: TradingView, click to enlarge chart)
Through the lens of technical analysis, the recent sell-off in Gold (XAU/USD) may have reached a bearish exhaustion inflection level at the US$2,353 short-term pivotal support (also the 50-day moving average).
Reinforced by the bullish divergence condition seen on the hourly RSI momentum indicator at its oversold region, a clearance above US$2,386 near-term resistance (potential upside trigger level) may see the next intermediate resistances to come in at US$2,411 and US$2,431 in the short-term horizon (see Fig 2).
However, failure to hold at US$2,353 is likely to see the extension of the corrective decline to expose the next intermediate supports at US$2,337 and US$2,320 in the first step.