
- Oil prices have faced challenges recently, but buying pressure prevented a drop below $80.
- Technical indicators suggest potential for an upward bounce, with key resistance levels to watch.
- Fundamental factors like Canadian wildfires, US stockpiles, and rate cut expectations support oil prices.
Oil prices faced challenges yesterday until buying pressure during the US session prevented crude oil from dropping below the psychological 80.00 mark.
Currently, oil is on track for a third consecutive week of losses unless bullish momentum persists through Friday, which could result in oil finishing the week flat or with slight gains.
WTI losses have outpaced Brent this week, this could in part be down to output fears in Canada exerting downward pressure on WTI. Wildfires in Canada have led some producers to reduce production at a time of peak demand in both the US and Canada.
The drop of 8.1% in Chinese oil demand in June to 13.66 million bpd spooked market participants and brought growth concerns to the fore. The Chinese authorities did slash interest rates this week in a bid to ensure the economic targets set by the Government are reached.
In the Middle East, hopes for a ceasefire are growing despite ongoing tit-for-tat attacks between Israel, Hezbollah, and the Houthis in Yemen. On Friday morning, leaders from Australia, New Zealand, and Canada issued a joint statement calling for an immediate ceasefire. Such a ceasefire could help ease fears of a broader conflict, which could have significant implications for oil prices and supply chains.
Later in the day we have the US PCE data release which could stoke some short-term volatility and may be worth paying attention to.
Technical Analysis Oil
From a technical perspective, Brent appeared poised to test the 80.00 per barrel psychological mark. However, buying pressure during the US session yesterday around the 80.50 level pushed Brent prices back above the key resistance level at 81.58.
The daily candle closed with a hammer candlestick pattern, engulfing the previous two daily candles. Theoretically, this suggests further upside potential, though it will face several obstacles if Brent is to revisit its early July high around 88.552.
A move higher will need to overcome the confluence area around 83.00, where the 200-day moving average currently lies. A daily candle close above these hurdles could see Brent aiming for resistance at 84.727, before encountering the 100-day moving average at 85.277.
Conversely, a downward push would require a daily candle close below the 81.580 support level, opening the possibility of a move toward the 80.00 mark and potentially down to the recent lows around the 77.00 handle.
On the fundamental side, oil price fundamentals still seem supportive. Factors such as the Canadian wildfires affecting production, declining US stockpiles, and rate cut expectations are all providing support. Additionally, interest rate cuts in China might be seen as positive for oil prices and may not yet be fully priced in.
Brent Oil Chart, July 26, 2024
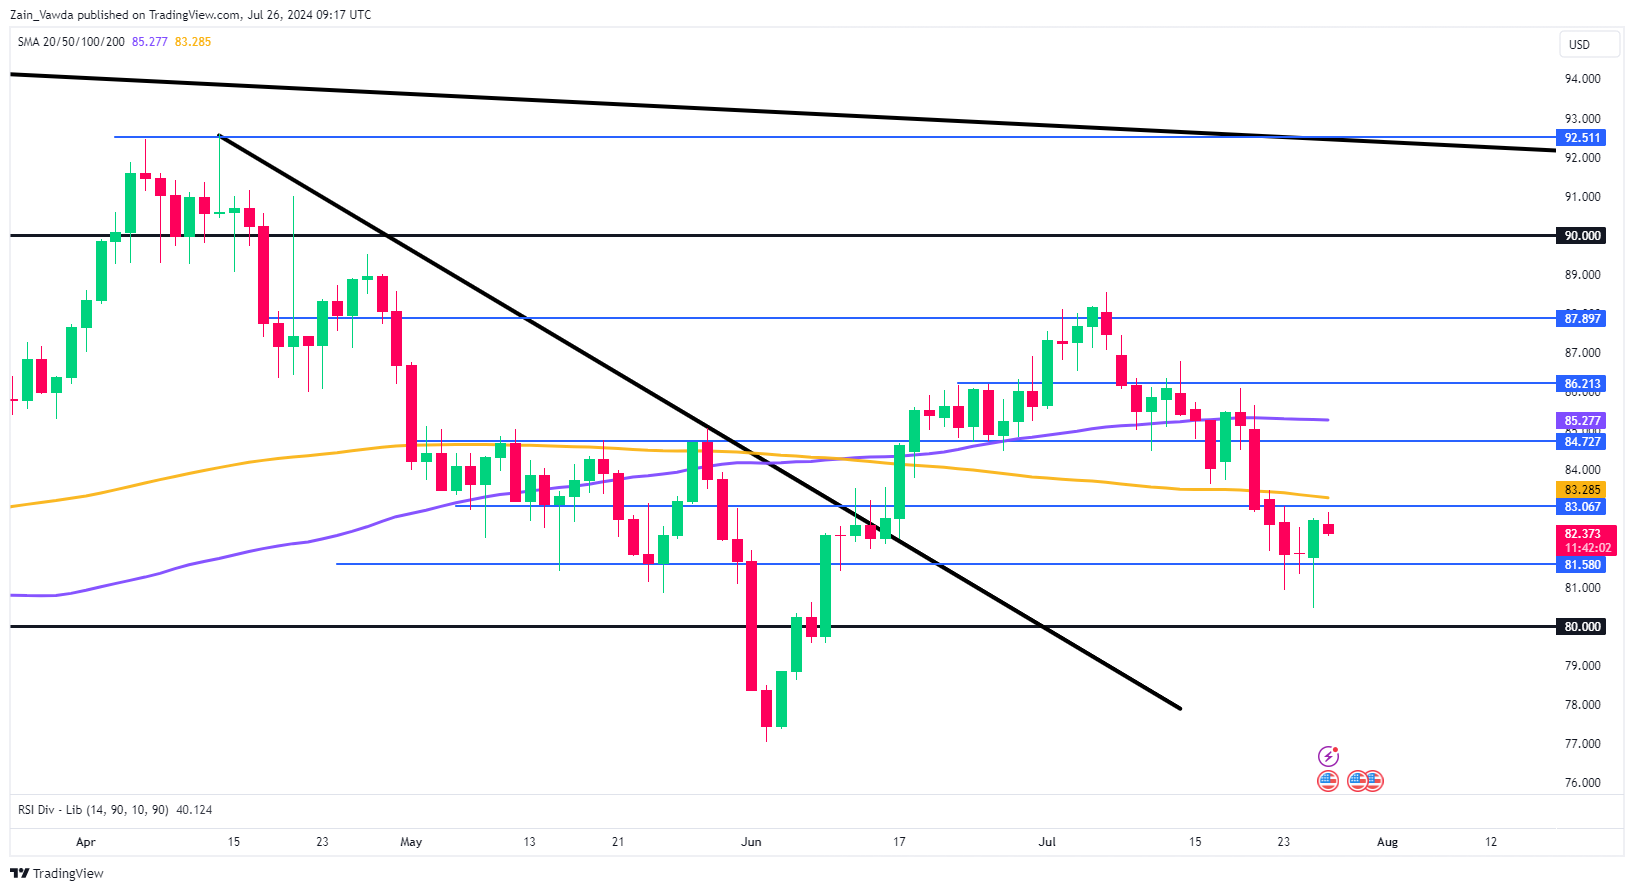
Source: TradingView (click to enlarge)
Support
- 81.58
- 80.00
- 77.00
Resistance
- 83.06
- 84.72
- 86.21