
- Presidential race dominates headlines and complicates Fed’s job
- Equities suffered in the two months leading up to the last six presidential elections
- Market’s performance in the 2016 pre-election period could be a useful guide
- Dollar strengthened in 2016 but equities were under pressure
Significant developments in the race lately
The recent gun attack against Donald Trump and US President Biden’s candidacy withdrawal last weekend have raised even more the profile of the November presidential election. As a result, the market is starting to price in an increased possibility of Trump returning to the White House for a second term.
In these volatile conditions, the Fed is facing an uphill battle to implement its strategy. The market is currently fully pricing in a 25bps rate cut in September, the first rate cut since March 2020, despite data remaining strong. In a recent special report focusing on the pre-Fed meeting performance of key market assets, a strong resemblance of current price action to the 2006-07 period was identified.
This means that should history repeat itself, the S&P 500 index could experience a sizable correction, the drop in US 10-year yield could have legs and the yen could benefit further against the US dollar in the run up to the September Fed gathering.
Interestingly, it is the first since 2000 that the Fed is preparing to start a monetary policy easing cycle in the period leading up to the US Presidential election. Back in 2000, Chairman Greenspan opted to maintain the Fed’s stance, despite the evident economic slowdown, to avoid criticism about interfering in the election.
Returning to the November elections and the performance of key market assets in the two months leading up to the US election was examined, using data from the last six US Presidential elections. A number of questions were posed. Are there any assets that benefit from the pre-election uncertainty? Are there any specific S&P 500 sectors that feel jittery in this period? Additionally, what did the market do in 2016, ahead of the election won by Donald Trump?
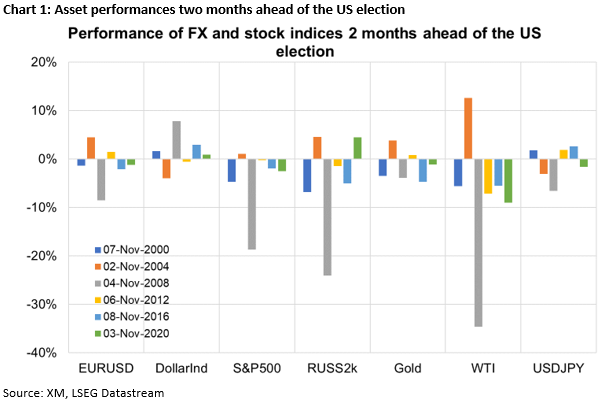
Asset performances two months ahead of the US election
Digging through the data, some interesting, mostly negative, trends can be identified. More specifically, WTI oil futures show a tendency to drop by 5.5%-12.6% in the run up to the election. Similarly, the S&P 500 equity index dropped by 0.3%-18.7% in five of the past six elections, revealing a certain degree of anxiety among investors. Chart 1 below presents the detailed results.
S&P 500 subsectors performance
Looking under the hood, the analysis showed a mixed performance by the eleven sectors comprising the S&P 500 index. Interestingly, the real estate, consumer staples and communication services stocks tend to react more negatively to election uncertainty. Chart 2 portrays these sectors and their respective pre-election performance.

It sounds reasonable that elections tend to affect stocks more than other asset classes. Big risk events negatively affect consumer sentiment, delay business investments and generally force corporations to postpone important decisions until after the election when they will have a clearer view of the new administration in place.
Interestingly, the dollar does not exhibit a clear-cut pattern with the dollar index being in the green in the pre-election periods of 2000, 2008, 2016 and 2022 but suffering in both 2004 and 2012. On the flip side, the 10-year US yield tends to increase by 7.5-26bps in the last two months before the election process, possibly on the back of campaign talk about increased public spending.
What happened in 2016 when Trump was a candidate?
Since Trump is trying to return to the Oval Office, the market’s performance in the two months leading up to the 2016 US election should be examined more closely. Chart 3 below displays the performance of certain market assets going for the aforementioned period.
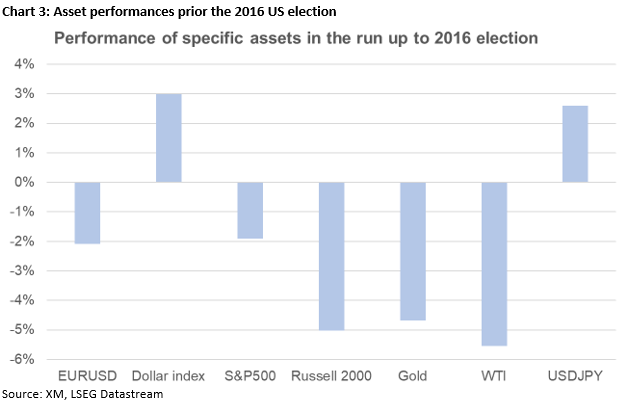
The dollar strengthened into the election as made evident by euro/dollar, dollar/yen and the dollar index. This dollar outperformance could partly explain the strong correction seen in both gold and WTI oil prices in the same period. In the meantime, the S&P 500 index managed to drop by around 2% going into the November 2016 election with the Russell 2000 index suffering the most.