
 shed close to -US$760 billion loss in their combined market capitalization in a single day on Wednesday, 26 July 2024.)
- Market participants have started to question the earlier high earnings growth prospects placed on the “Magnificent 7” stocks.
- The past month of record low implied correlation among S&P 500 component stocks can increase the odds of a more pronounced spike in the VIX.
- The S&P 500 is at risk of shaping a medium-term (multi-week) corrective decline phase which may trigger a global risk-off scenario.
The mega-capitalization stocks have led yesterday’s rout in the US stock market where the Magnificent 7 cohort (Apple, Amazon, Microsoft, Nvidia, Tesla, Alphabet, and Meta) shed close to -US$760 billion loss in their combined market capitalization in a single day on Wednesday, 26 July 2024.
The Nasdaq 100 has the highest weightage of the “Magnificent 7” group of stocks among the major benchmark US stock indices, bled the most with a daily loss of -3.65%, its worst daily performance since 7 October 2022. This set of horrendous performance came after the bearish breakdown below its 19,520 key short-term pivotal support as highlighted in our previous report reinforced by a disappointment in the Q2 earnings results of Tesla and Alphabet.
The weakness inherent in the higher beta Nasdaq 100 has triggered a negative feedback loop into the broader S&P 500 that shed 2.32 %; its worst daily performance since 15 December 2022 after it notched 38 record closing highs this year and ended its best streak without a 2% decline since the Great Financial Crisis of 2007.
The current month-to-date outperformers as of 24 July, the Dow Jones Industrial Average (+1.88%), and Russell 2000 (+7.21%) that have benefitted from the bull steepening of the US Treasury yield curve (10-year minus 2-year) were not spared from yesterday’s mega-cap onslaught as both of them recorded daily losses of 1.25% and 2.13% respectively.
Implied low correlation and volatility may trigger further sell-off
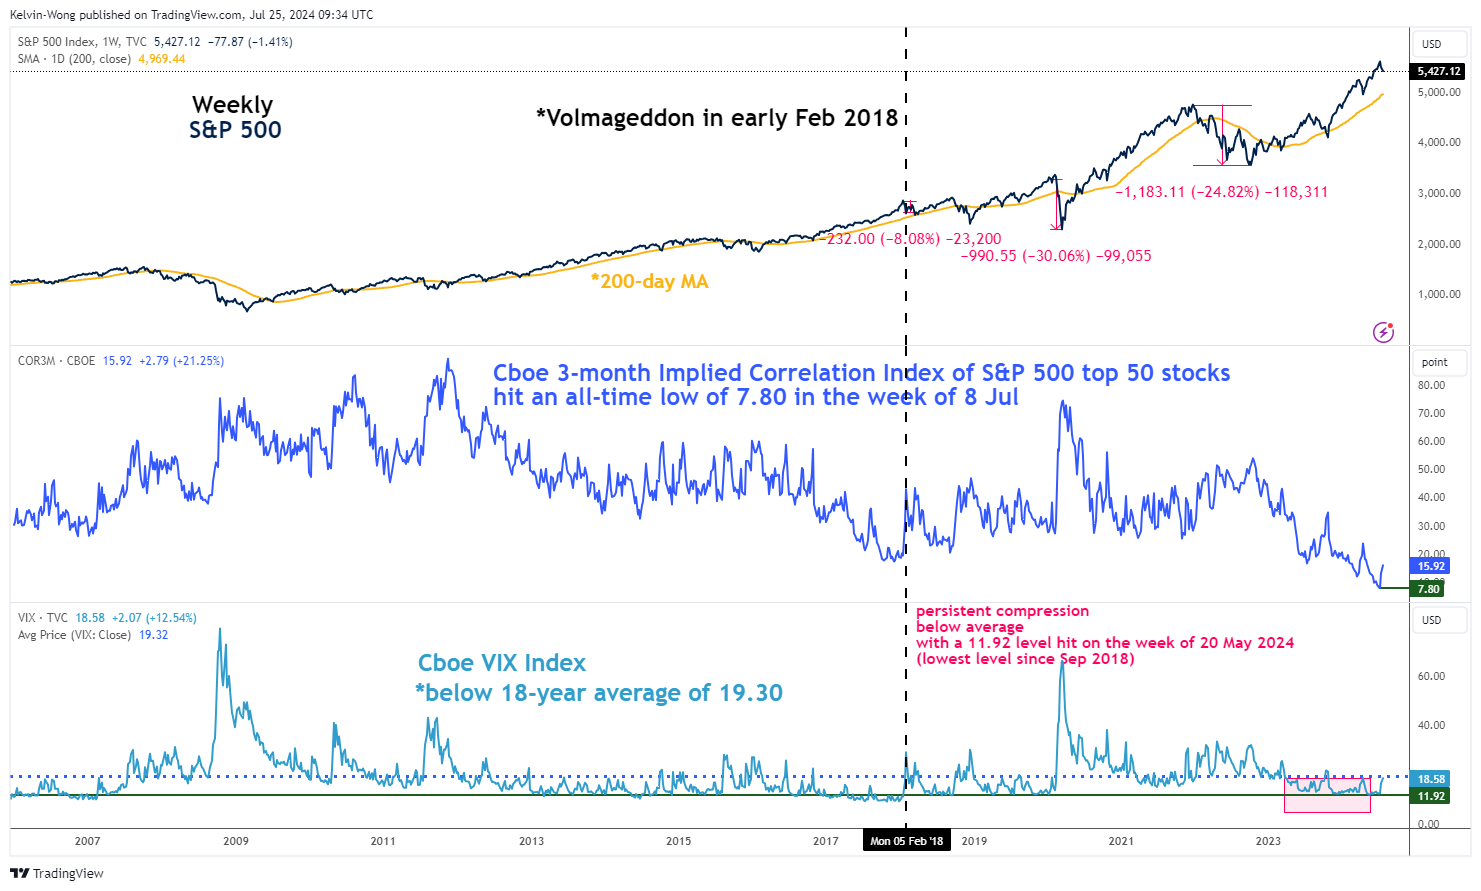
Fig 1: Cboe VIX & 3-month implied correlation index of S&P 500 constituents as of 24 Jul 2024 (Source: TradingView, click to enlarge chart)
Another interesting point to note is the recent plunge in the VIX (implied volatility of the S&P) to almost a six-year low of 11.92 on the week of 20 May 2024 which in turn has coincided with market participants’ perceptions of future low correlation readings (higher dispersion of returns on the average) among the US S&P 500 index constituents.
The Cboe 3-month Implied Correlation Index measures the 3-month expected correlation across the top 50 market capitalization-weighted S&P 500 constituents which have slipped to an all-time low reading of 7.80 on the week of 8 July 2024 as artificial intelligence optimism has led to outsized gains in the “Magnificent 7” excluding Tesla since the start of this year versus meagre gains seen from the other 494 component stocks of the S&P 500.
The persistent trend of lower “lows” seen in the Cboe 3-month Implied Correlation Index in the past three months has helped to depress the VIX which in turn created an artificial calm in the overall stock market that led to a higher degree of “complacent risk-on or seeking behaviour”. The VIX hit a level of 11.92 on the week of 20 May 2024; its lowest level since September 2018 and continued to remain compressed below its 18-year average of 19.30 till the first two weeks of July 2024 (see Fig 1).
Hence, if the earnings results and or outlook disappoint in next week’s earnings reports for other Magnificent 7 stocks (Amazon, Apple, Microsoft, and Meta), the VIX may see a further spike which is likely to trigger a medium-term corrective decline sequence in S&P 500 and triggered a negative feedback loop into other global stock indices.
S&P 500 at risk of breaking below its 50-day moving average
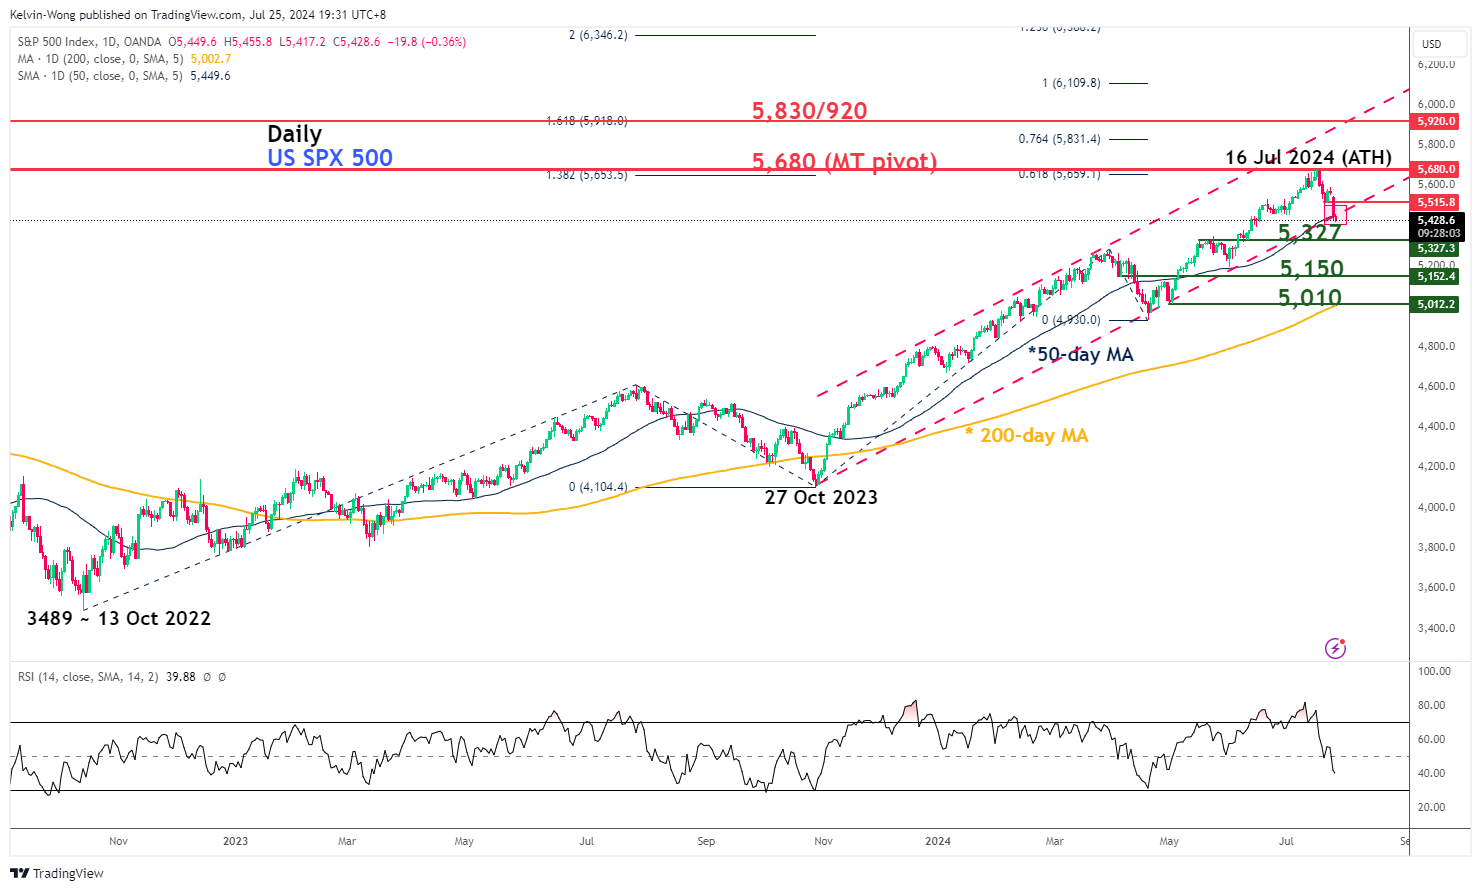
Fig 2: US SPX 500 medium-term & major trends as of 25 Jul 2024 (Source: TradingView, click to enlarge chart)
Based on the current price actions of the US SPX 500 CFD Index (a proxy of the S&P 500 E-mini futures), it is now looking vulnerable for a breakdown below its 50-day moving average and the lower boundary of its medium-term ascending channel from 27 October 2023 low.
In addition, the medium-term momentum condition has turned bearish as depicted by the latest reading on the daily RSI momentum indicator as it broke below the 50 level on Wednesday, 24 July, and has not reached its oversold region yet.
These observations suggest that the medium-term uptrend phase in place since the 27 October 2023 low has been damaged. A break below the intermediate support at 5,327 may reinforce a medium-term (multi-week) corrective decline phase to expose the next supports at 5,150 and 5,010 (also the 200-day moving average) in the first step (see Fig 2).
On the other hand, a clearance above 5,680 key medium-term pivotal resistance reinstates the bullish impulsive upmove sequence to see the next medium-term resistance coming in at 5,830/920.