
 has staged a decline of 6.2% from its all-time intraday high of 20,792 printed on 11 July to an intraday low of 19,501on last Friday, 19 July.)
- Market breadth indicators (% of component stocks above 20-day & 50-day moving averages) have increased to above 50%.
- Short-term bullish momentum condition sighted at the retest of its 50-day moving average.
- Watch the 19,520 key short-term support ahead of a risk event; the earnings results of Alphabet & Tesla after today’s US session close.
In the past two weeks, the Nasdaq 100 CFD (a proxy of Nasdaq 100 E-mini futures) has staged a decline of 6.2% from its all-time intraday high of 20,792 printed on 11 July to an intraday low of 19,501on last Friday, 19 July.
Also, it underperformed the value-oriented Dow Jones Industrial Average (+1.5%) and small-caps Russell 2000 (+4.7%) over the same period primarily driven by the bull steepening of the US Treasury yield curve (10-year minus 2-year).
In the lens of the technical analysis, the Nasdaq 100 CFD may have reached an inflection point for a potential bullish reversal ahead of the release of Tesla and Alphabet Q2 earnings results after the close of today, 23 July US session.
The price actions of Tesla and Alphabet are likely to have a significant impact on the Nasdaq 100 because both are in the top 10 component stocks of the Nasdaq 100; ranked 7th and 8th respectively in terms of market capitalization.
Market breadth has improved
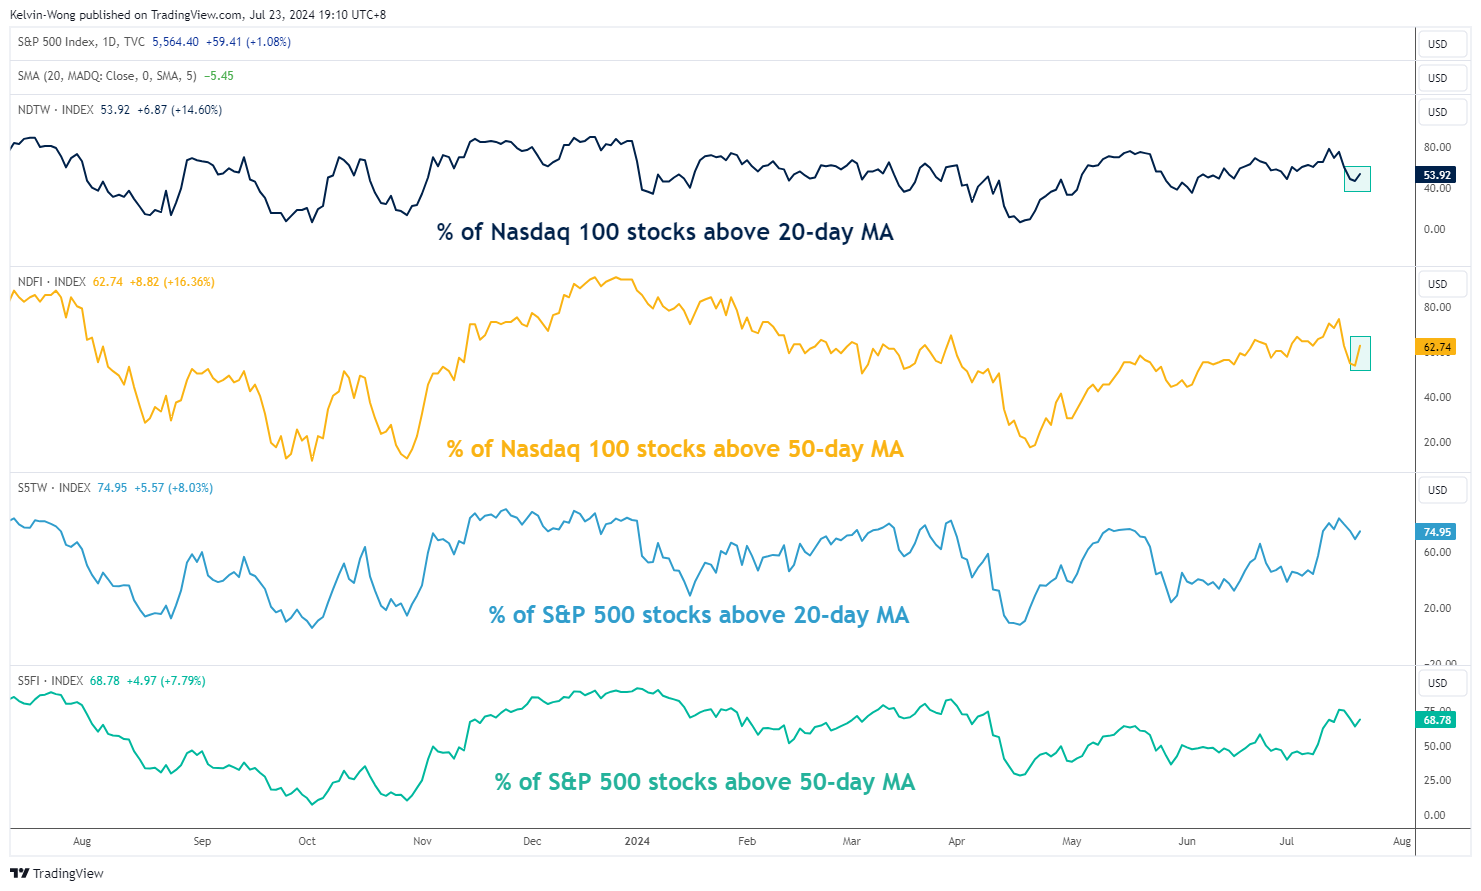
Fig 1: Market breadth indicators of Nasdaq 100 and S&P 500 as of 22 Jul 2024 (Source: Trading View, click to enlarge chart)
After a recent slide to around 50% from 12 July to 19 July on the percentage of Nasdaq 100 components stocks trading above their respective 20-day and 50-day moving averages, these two market breadth indicators have managed to improve on Monday, 22 July where both hit above the 50% mark again (see Fig 1).
The percentage of Nasdaq 100 component stocks above their 20-day moving averages increased from 47% on Friday, 19 July to 54% on Monday, 22 July.
In addition, the percentage of Nasdaq 100 component stocks above their 50-day moving averages jump more significantly from 54% on Friday, 19 July to 63% on Monday, 22 July.
These current positive market breadth observations suggest the short and medium-term uptrend phases of the Nasdaq 100 remain intact.
Short-term bullish momentum condition sighted
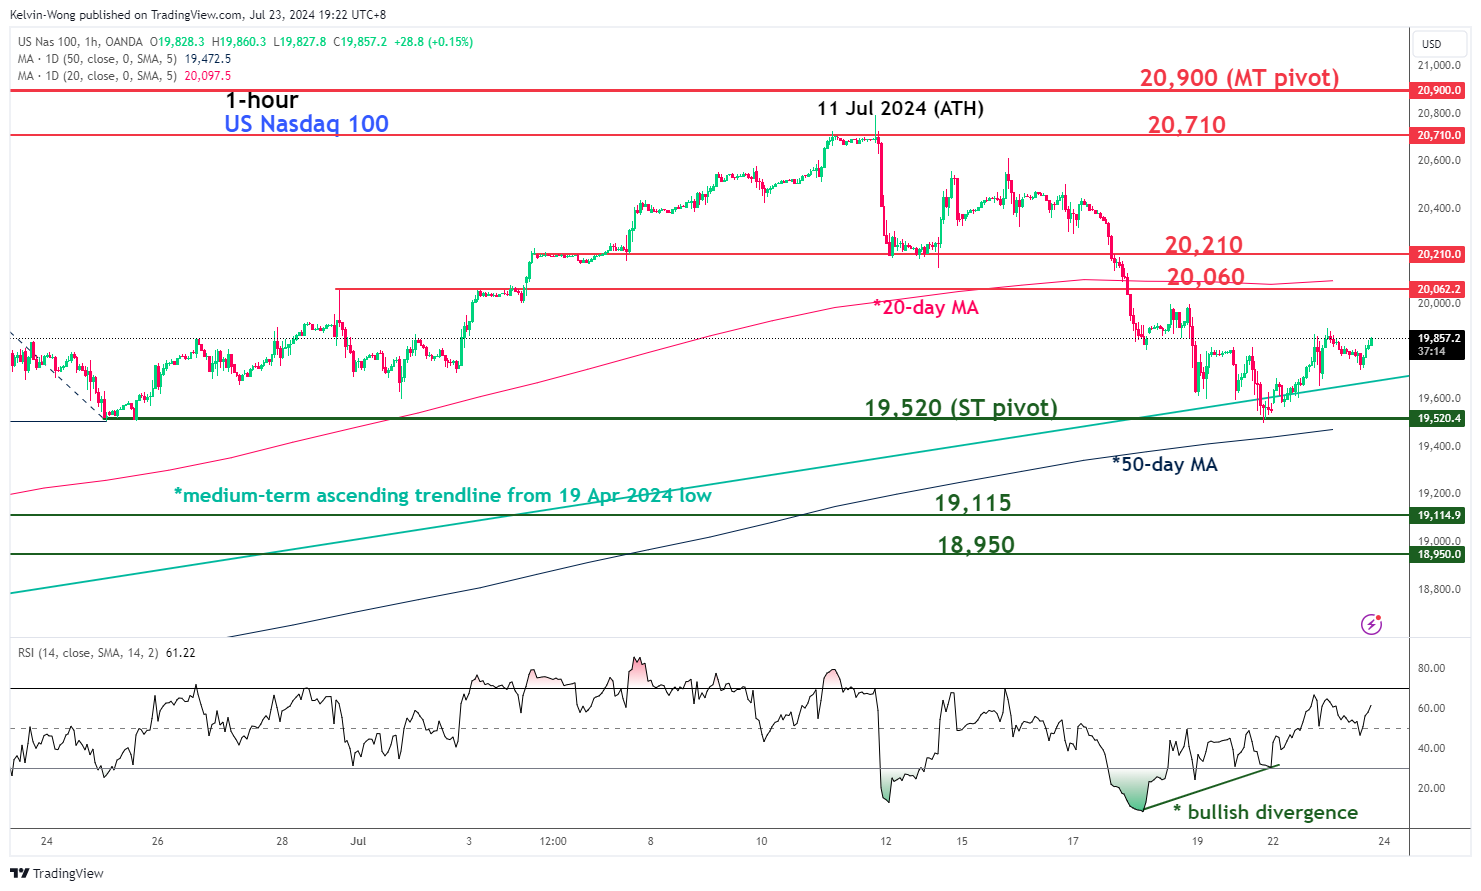
Fig 2: Nasdaq 100 CFD short-term trend as of 23 Jul 2024 (Source: Trading View, click to enlarge chart)
After a bullish divergence condition sighted on the hourly RSI momentum indicator on Friday, 19 July, the price actions of the Nasdaq 100 CFD have a positive follow-through right at its 50-day moving average and its medium-term ascending trendline from 19 April 2023 low.
These short-term positive price actions suggest a potential bullish reversal scenario if the 19,520 pivotal support holds (see Fig 2).
The next near-term resistance zone to watch will be at 20,060/20,210 (also the 20-day moving average) and a clearance above it increases the odds of another impulsive upmove sequence to retest the current all-time high area at 20,710 before the medium-term pivotal resistance comes in at 20,900.
On the other hand, a break below 19,520 invalidates the bullish reversal scenario for a deeper multi-week corrective decline to expose to the near-term supports at 19,115 and 18,950 in the first step.