
, the FTSE 100 has delivered a steady, though not spectacular, performance with gains around 6%.)
- The FTSE 100 is currently consolidating, trading within a range, with the possibility of a significant breakout.
- Glencore and Anglo American experiencing declines while Compass reports strong revenue growth.
- The S&P 500 faces a critical resistance level that could shift market momentum, with Alphabet and Tesla’s earnings reports expected to influence investor sentiment.
FTSE 100
The FTSE 100 has entered a period of consolidation following the UK election, posting a modest gain of approximately 0.29% for July. Year-to-date (YTD), the FTSE 100 has delivered a steady, though not spectacular, performance with gains around 6%.
The start of this week has seen some notable movements, particularly in the mining sector. Miner and commodities trader Glencore (GLEN.L) fell as much as 2.4% this morning, leading the losses on the FTSE 100. This decline followed an HSBC analyst downgrade, which reduced Glencore’s price target from 455p to 435p and Anglo American’s (AAL.L) price target to 2300p due to the temporary closure of GEMCO’s operations.
As a result, Glencore is down about 8% YTD, while Anglo American remains up approximately 11.5% YTD.
Sector Performance, FTSE 100, July 23, 2024
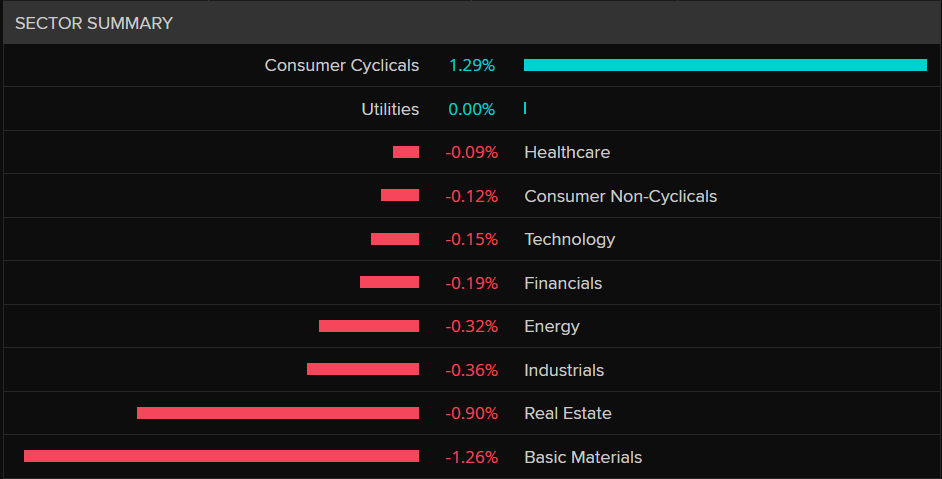
Source: LSEG
The standout performer today has been contract caterer Compass (CPG.L), which reported a 10% rise in revenue and highlighted strong industry trends. The only downside noted by Compass was the strength of the GBP, which has been near multi-month highs. The company’s stock is up 4.88% on the day, leading the day’s gainers.
FTSE 100 Daily Chart, July 23, 2024
Source: TradingView.com (click to enlarge)
Since the UK election, the FTSE 100 has been trading within a range, consolidating between the support level at 8117 and the resistance level at 8273. Recent price movements have been erratic, with lower highs and higher lows indicating market indecision.
The longer prices remain in a range or wedge pattern, the more intense the eventual breakout is likely to be. For intraday trading, immediate resistance is at 8240, followed by the top of the wedge pattern near the 8273 mark.
On the downside, initial support is at 8187, with further support at the lower end of the wedge pattern and the 8117 level.
S&P 500: Earnings Heats Up, Tesla (TSLA.O) and Alphabet (GOOGL.O) After Market Close Today
The S&P 500 and the Nasdaq 100 are heading into a significant week following last week’s tech selloff. Earnings reports from major tech companies begin today, with Alphabet (GOOGL.O) and Tesla (TSLA.O) both releasing their results after market close (PMC).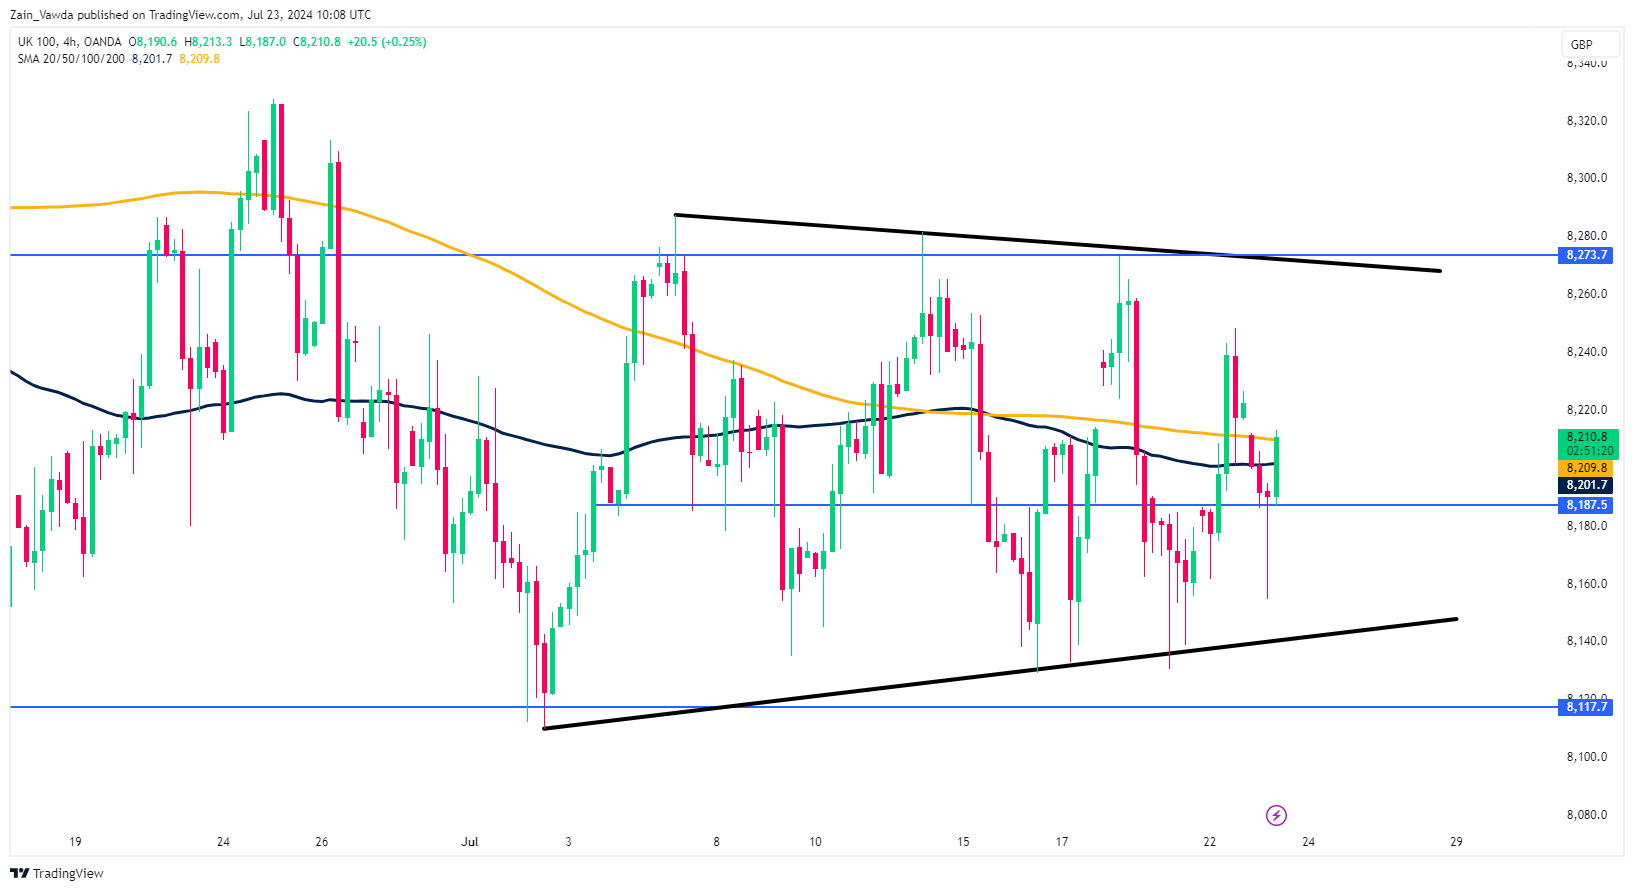
What can we expect from Alphabet?
Alphabet is expected to report earnings of $1.85 per share for the second quarter, which is slightly lower than the $1.89 per share from the previous quarter but still a 28% increase compared to the same quarter last year.
Total revenue is projected to be $84.3 billion, marking a 4% increase from the first quarter and a 13% rise compared to the same period last year.
The Graph below depicts the Price Target average by various institutions around the world.
*The Chart below is based on a average estimates by analysts who have set a price target around $199.37. The current price of Alphabet shares are around the $181, which means analyst are eyeing further gains of around 10% for Alphabet moving forward.
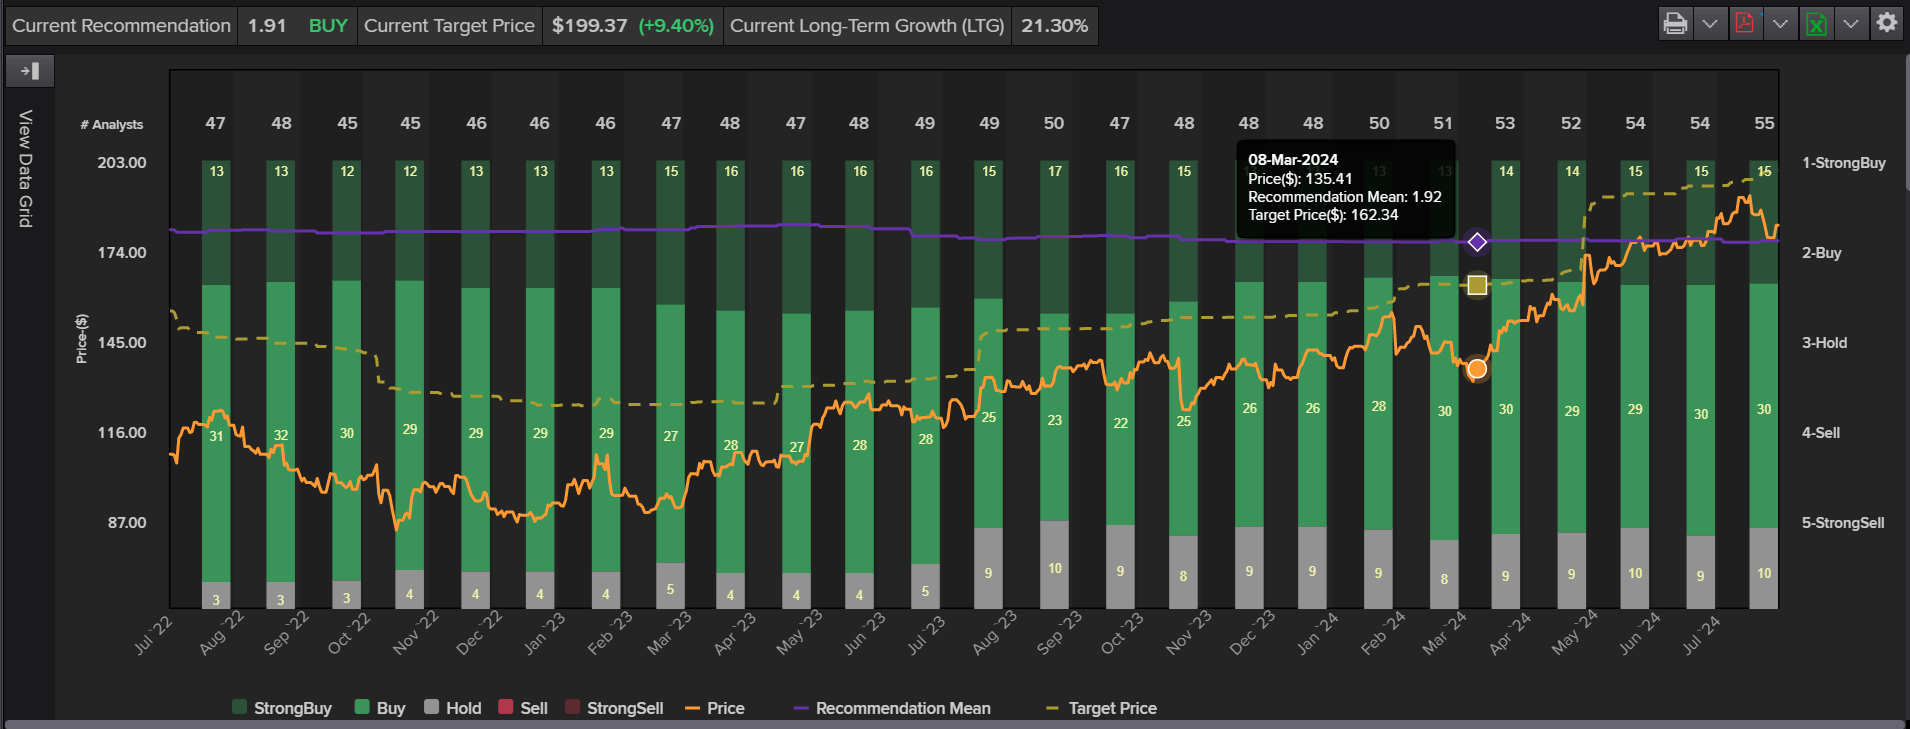
Source: LSEG
Markets seem slightly more cautious due to the recent sector rotation, which has favored smaller stocks and benefited the Russell 2000 index.
For now, US election uncertainty is taking a backseat as it appears that current Vice President Kamala Harris will secure enough votes for the Democratic party nomination. This development seems to have alleviated concerns among market participants regarding a potential challenger to Donald Trump.
S&P 500 Daily Chart, July 23, 2024
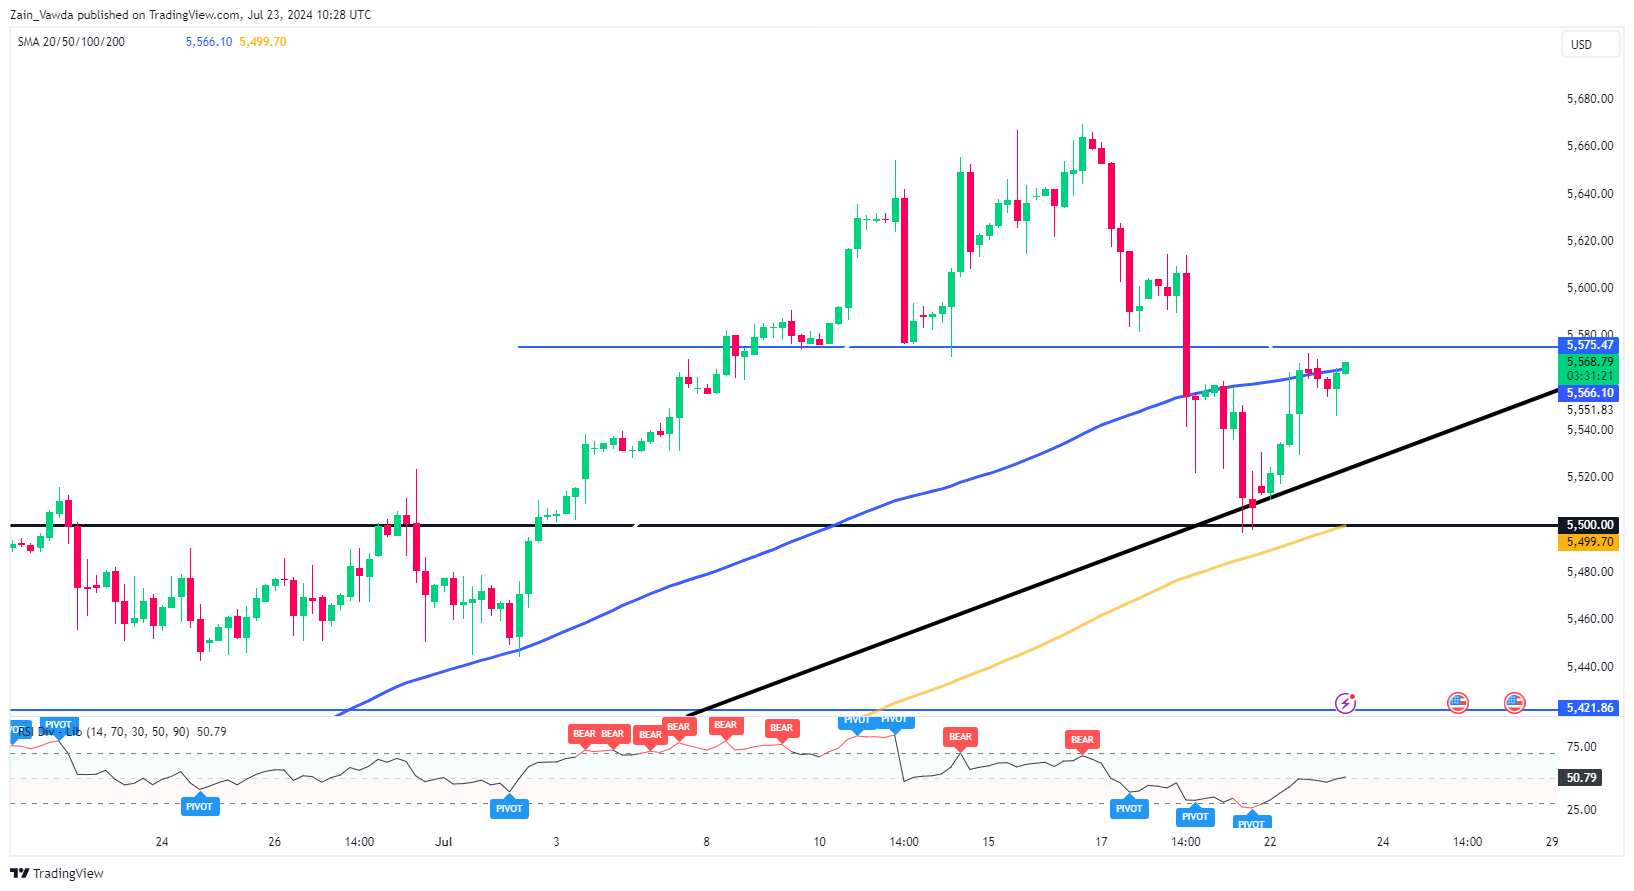
Source: TradingView.com (click to enlarge)
The S&P 500 is approaching a crucial resistance level that could shift market momentum and encourage bullish sentiment. After rebounding from the ascending trendline and moving higher again, the resistance zone around 5575 will be critical.
If a four-hour candle closes above 5575, it could pave the way for further gains. The next key level to watch is around 5600, followed by the recent highs near 5660.