
Bullish Scenario: Buy above 156.45 with targets at 157.16, 157.90, and 158.10 in extension. Set S.L below 155.80 or at least 1% of the account’s capital. Apply Trailing Stop.
Bearish Scenario: Sell below 157.16 or 157.90 (where a PAR* forms) with TP1: 156.00, 155.80, 155.00, and 156.56 in extension with S.L above 158.00 or at least 1% of the account’s capital.
Fundamental Analysis
The dovish speech by the Fed Chairman has fueled a market sentiment where the federal funds futures price in over a 90% chance of a rate cut by the Fed in September, which has led to a bearish sentiment for the dollar due to increased bond purchases, causing yields to drop.
Additionally, the current account balance data from the Bank of Japan, released on Tuesday, showed a liquidity outflow of about 2.74 trillion yen ($17.3 billion) from the financial system related to various transactions involving the government sector. This follows an earlier forecast of a 600 billion yen drainage, indicating intervention by the Bank of Japan in the forex market.
The movements appear to have occurred on Thursday and Friday, July 11 and 12, 2024.
Technical Analysis, H2. Intraday and Swing Outlook
USDJPY
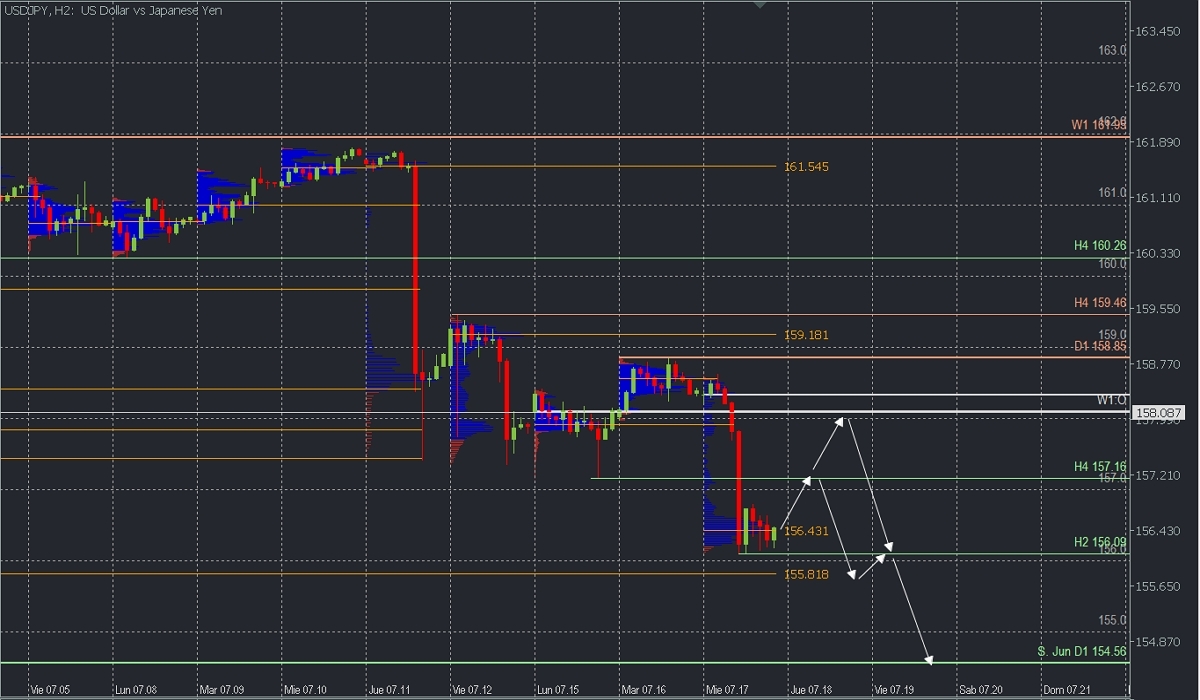
- Supply Zones (Sales): 157.90, 158.56, and 159.18
- Demand Zones (Buys): 156.43 and 155.81
After reaching a forty-year high on July 3 at 161.95, the quotes remained consolidated with the possibility of continuing the ascent until the recent aggressive activity on Thursday, July 11, where the price broke the last relevant support of the bullish trend at 160.26, subsequently confirmed with a new low on Friday, July 12, in what can be considered two consecutive interventions by the Bank of Japan to prevent excessive currency devaluation, causing an intraday trend change of the pair.
Today’s sharp decline on July 17 adds a new expansion of weakness, leaving support at 156.09 and a volume concentration at 156.43. Therefore, a correction is expected over this zone with a target at the broken support of 157.16 and with greater volatility at the broken demand zone, now turned into a supply zone, between 157.90 and 158.08, from where it is expected to gain selling liquidity again to extend the descent towards the June support at 154.56 for the rest of the week.
This bearish scenario will remain valid as long as the next correction does not exceed the last relevant resistance of the new bearish trend at 158.85.
*Discovered POC: POC = Point of Control: It is the level or zone where the highest volume concentration occurred. If there was a previous downward movement from it, it is considered a selling zone and forms a resistance zone. Conversely, if there was a previous upward movement, it is considered a buying zone, usually located at lows, thus forming support zones.