
- Anticipation is high for the release of US CPI data, which is expected to influence market movements, especially the US Dollar Index (DXY).
- The market has priced in an 71.8% chance of a September rate cut, and if inflation aligns with or falls below forecasts, this likelihood could increase.
- Technically, the DXY is range-bound, hovering between 104.80 and 105.20, with support at the 100-day and 200-day moving averages and resistance at 105.63 and 106.00.
US CPI data is set to be released tomorrow, promising to stir volatility in an otherwise quiet week. Market participants are eagerly awaiting the data, as evidenced by the recent indecision in the markets.
The US Dollar Index (DXY) exemplifies this uncertainty with significant sideways price action this week. The inflation data follows a series of underwhelming data releases from the US, leading market participants to price in nearly an 71.8% chance of a rate cut in September.
Markets are expecting further moderation in tomorrow’s inflation data. If inflation moves closer to the Fed’s 2% target, it will bolster hopes of a rate cut, especially after Fed Chair Powell’s testimony this week. Powell emphasized that the Fed doesn’t want to wait until inflation reaches 2% to ease policy, explaining that the Fed seeks greater confidence in inflation trends.
Let us take a look at what Investment Banks are forecasting for tomorrow’s inflation print.
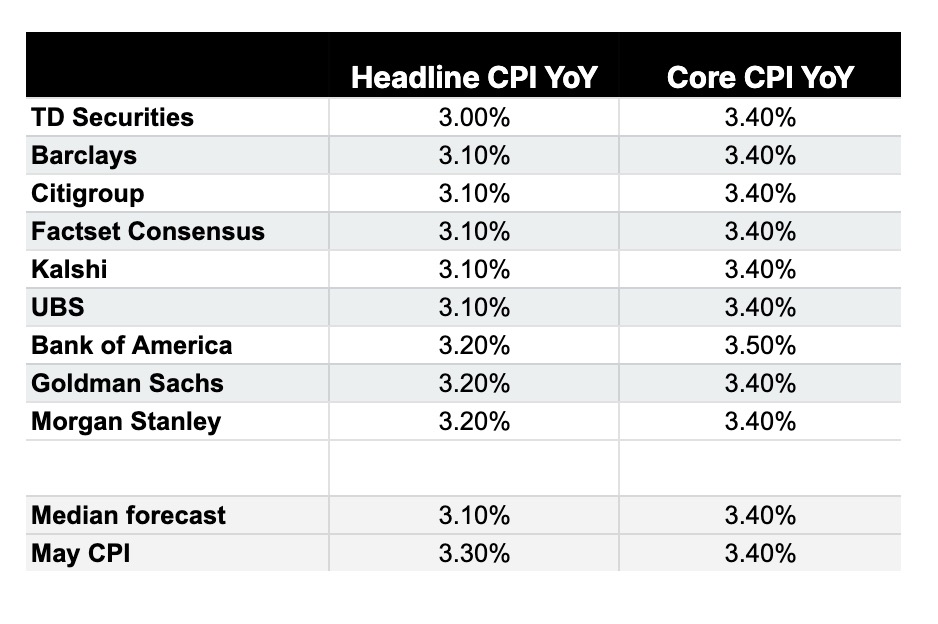
Source: The Kobeissi Letter
These comments will undoubtedly influence market participants as they approach tomorrow’s release. Should inflation match forecasts or come in lower, it could finally lead to sustainable market movements. This year has been characterized by quick, volatile moves quickly reversed in the days following. However, if inflation dips below the 3% mark, though unlikely, the market reaction could be markedly different this time.
Technical Analysis
From a technical standpoint, the DXY has been rangebound for quite sometime. The last few days however has seen very little in terms of price movement, as the price has hovered between 104.80 and 105.20.
The DXY is at somewhat of a critical juncture as the ascending trendline, 100 and 200-day MAs rest just below current price. Inflation data may serve as a catalyst for a break below the long-term trendline or finally facilitate a move toward the multi-month resistance at 107.00.
Either way, market participants will hope for volatility and secondly some medium term direction.
Support
- 105.00 (100-day MA)
- 104.47 (200-day MA)
- 104.00
- 103.00
Resistance
- 105.63
- 106.00
- 107.00
US Dollar Index (DXY) Daily Chart, July 10, 2024
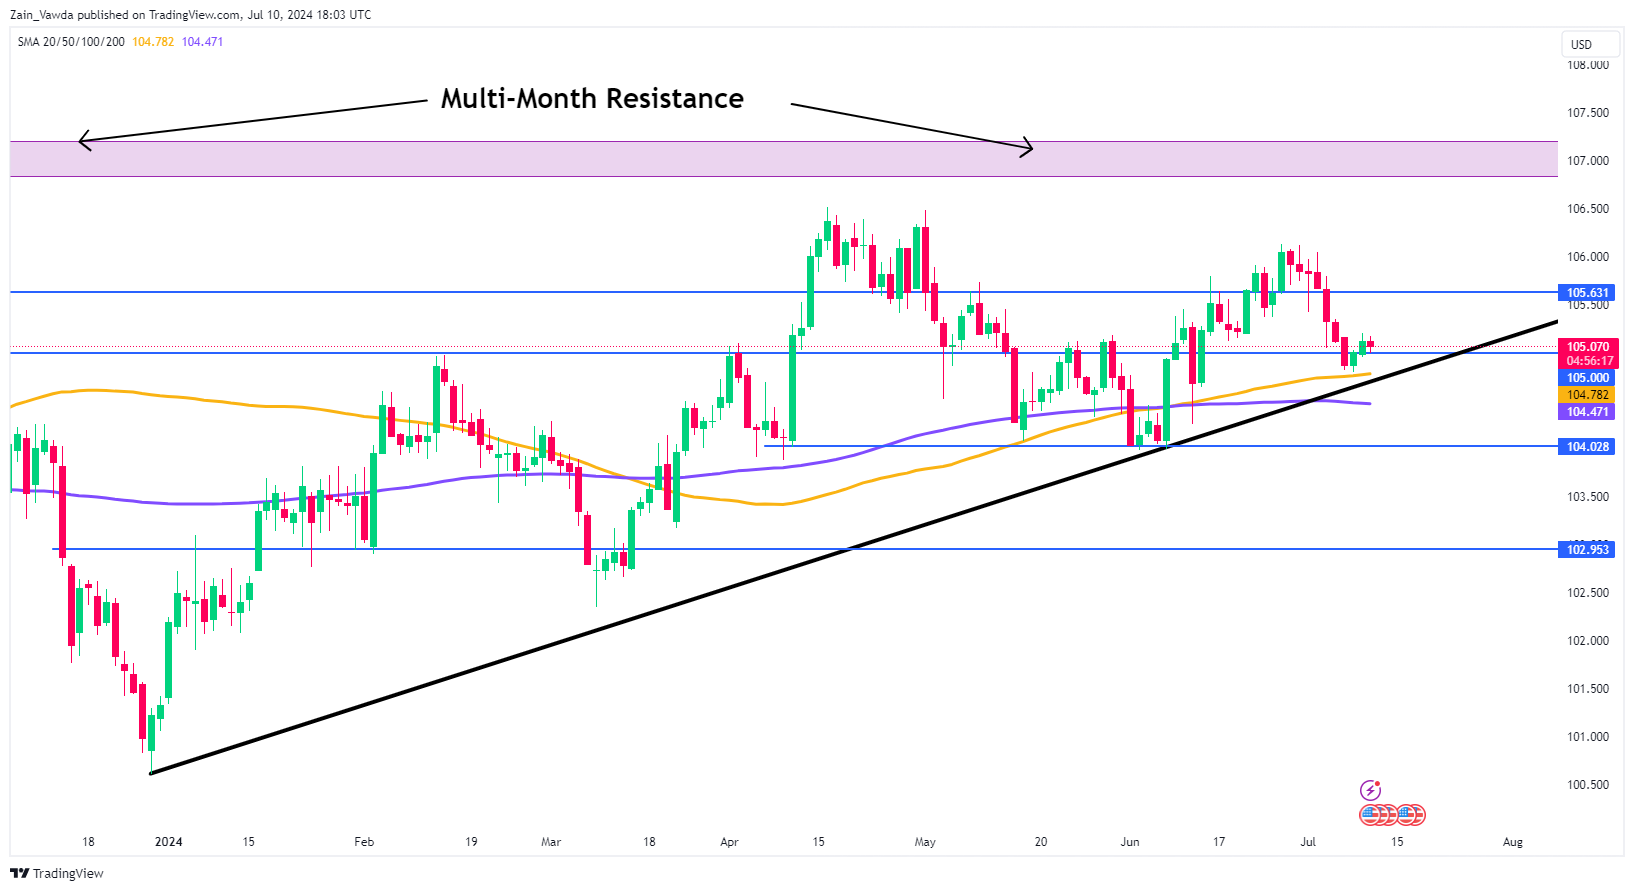
Source: TradingView.com (click to enlarge)