
 Governor Ueda at the June meeting of the BoJ. )
- FX intervention chatter returns, but is it enough for the ailing JPY?
- USD/JPY at psychological 160.00 handle.
- EUR/JPY prints morningstar candlestick pattern, hinting at the potential for further upside.
Fundamental Overview
The Japanese Yen continues to tread water against its G 7 peers as its monetary policy stance continues to be scrutinized. Many analysts, myself included, had hoped for a bold approach from Bank of Japan (BoJ) Governor Ueda at the June meeting of the BoJ.
The Governor however opted to remain cautious given the existential risks which have become a hot topic for central banks globally. Following a swathe of Central Bank meetings in June, the one commonality seems to be the uncertainty from the global geopolitical sphere, which many central banks see as the main risk for the second half of 2024.
Since the BoJ meeting in June, the Japanese Yen has come under renewed selling pressure. FX intervention has been used in the past by the central bank, but this doesn’t seem to have a lasting impact anymore.
Comments from policymakers and Japanese officials have had a similarly lackluster impact of late. Thus the comments this morning from top FX diplomat Masato Kanda is unlikely to rescue the ailing JPY. Mr Kanda stated authorities are prepared to step in to support the Japanese yen 24 hours a day, if necessary, the Yen was trading below 160 per US dollar and remains there for now. This was followed by comments this morning from Moody’s Analyst Christian De Guzman, who stated that the BoJ is likely to take time raising interest rates. Another hint that market participants may be in for a bumpy ride when it comes to the Japanese Yen in the coming months.
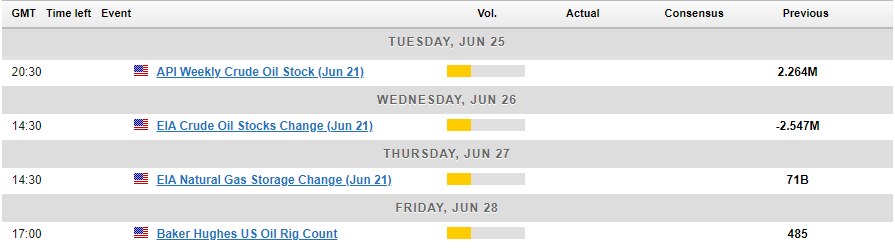
The Week Ahead: Japanese and US Inflation Data
Looking ahead to the rest of the week, there is a fair bit of data which could have an impact on Japanese Yen pairs. Most notably the US PCE data (Federal Reserve’s preferred inflation gauge) and of course the Japanese unemployment rate and Tokyo inflation numbers. ANy increase in the PCE number or a print above estimates could lead to US dollar strength as market participants may view it as a sign that rates may remain higher for longer.
The Japanese unemployment data may prove key as one of the sticking points for BoJ Governor Ueda has been improving wage growth. A rise in unemployment may signal that wage growth may remain stagnant while a drop in unemployment could be seen as signs of a tight labor market which usually results in upward pressure on wage growth.
Finally, geopolitics remains a significant focus, and this week could be pivotal for developments in the Middle East. Any increase in tensions between Israel and Hezbollah might drive investors toward safe-haven assets. Additionally, the week concludes with the first round of the French Parliamentary elections which could have a lasting impact on the Euro and by extension EUR/JPY moving forward.
Japanese Yen Technical Outlook
USD/JPY
Looking at USDJPY from a technical perspective, the weekly chart below shows a very bullish close last week with no wick to the upside. This is usually a sign of the momentum in play and this is also the first time the weekly candle has closed above 158.300 (the previous weekly candle high close).
USD/JPY Weekly Chart – June 24, 2024
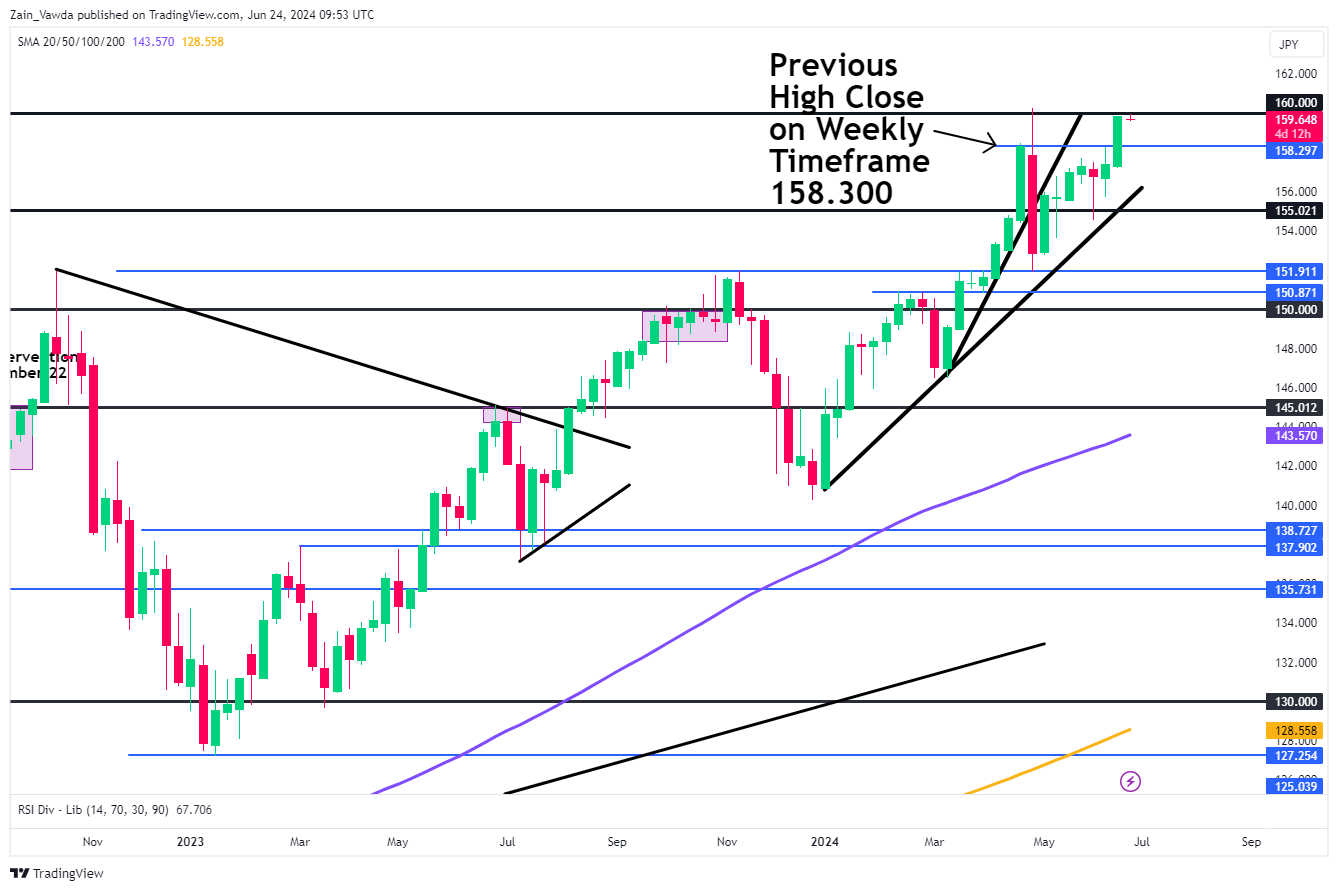
Source: TradingView.Com (click to enlarge)
Dropping down to the daily timeframe and here it is a bit more indecisive. Despite ending the previous week on a bullish note, Sunday saw USD/JPY gap down at the market open. This has been followed by a gradual push lower throughout the early part of the European session, thanks in large part to US dollar weakness rather than intervention hopes.
Looking ahead and should USD/JPY continue to fall, immediate support rests at 158.300 with the next key area of support resting at 157.739. A break of these levels opens up a test of 156.50 and of course the psychological 155.000 handle.
To the upside, the outlook remains more uncertain as we do not have a lot in the way of historical price action to pay attention to. The first thing that needs to happen if USD/JPY is to continue higher is a daily candle close above the 160.oo psychological mark. This would be a huge milestone and could facilitate further upside for USD/JPY.
USD/JPY Daily Chart – June 24, 2024
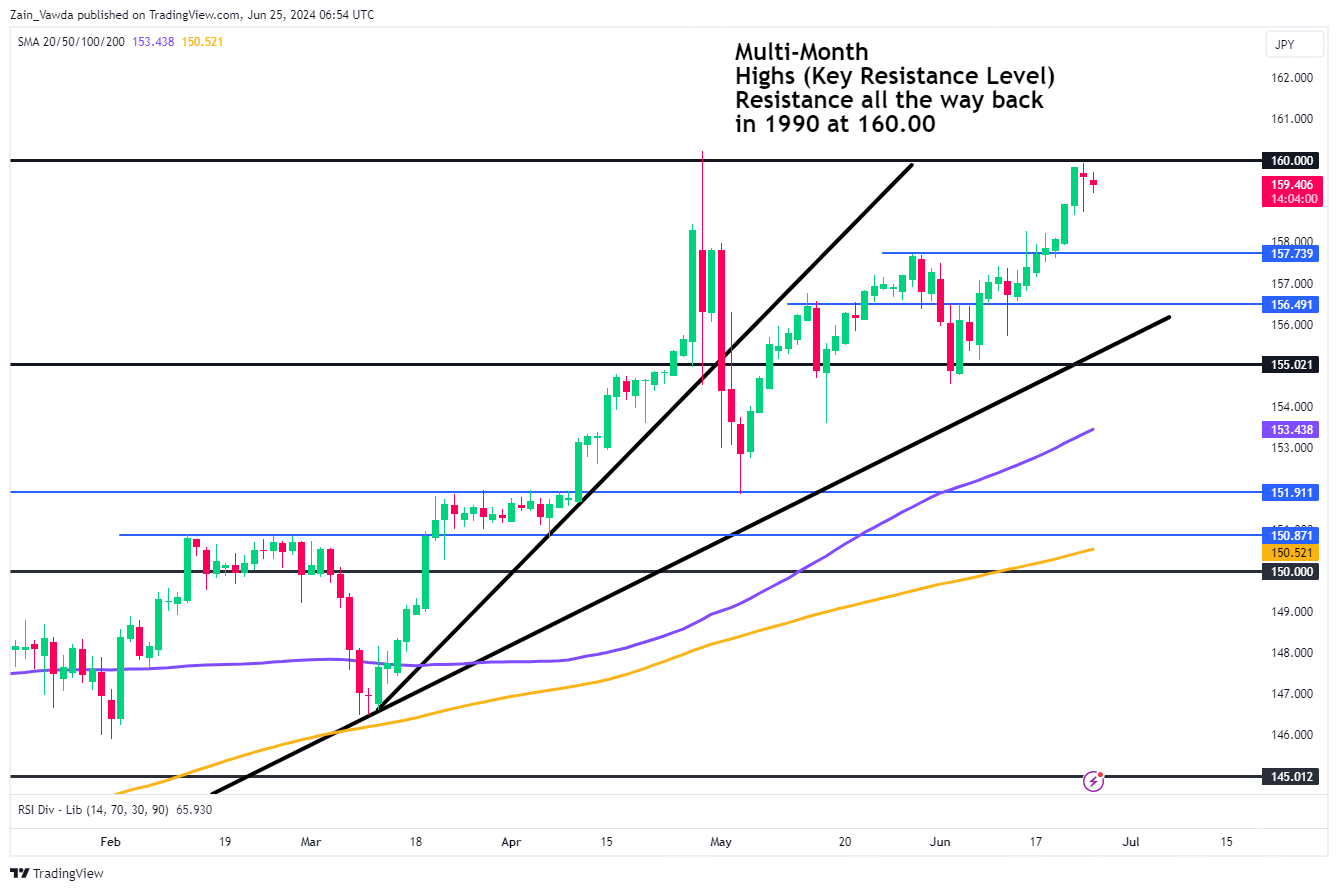
Source: TradingView.Com (click to enlarge)
EUR/JPY
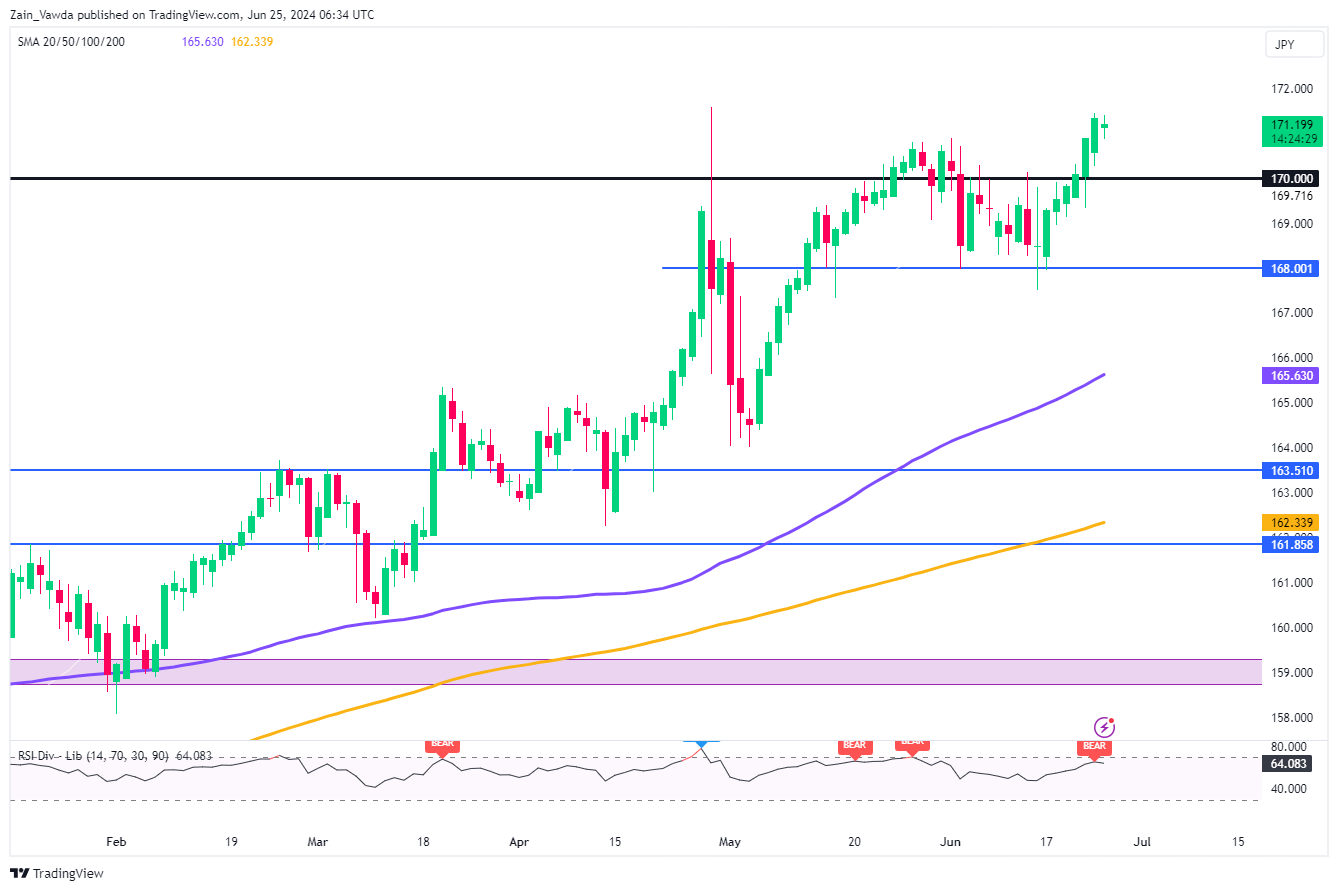
EUR/JPY on a weekly timeframe printed a bullish engulfing candle to close out last week while also closing above a key resistance level at the 170.00 handle. The weekly close looks to have a morningstar candlestick pattern hinting at further upside.
EUR/JPY Weekly Chart – June 25, 2024
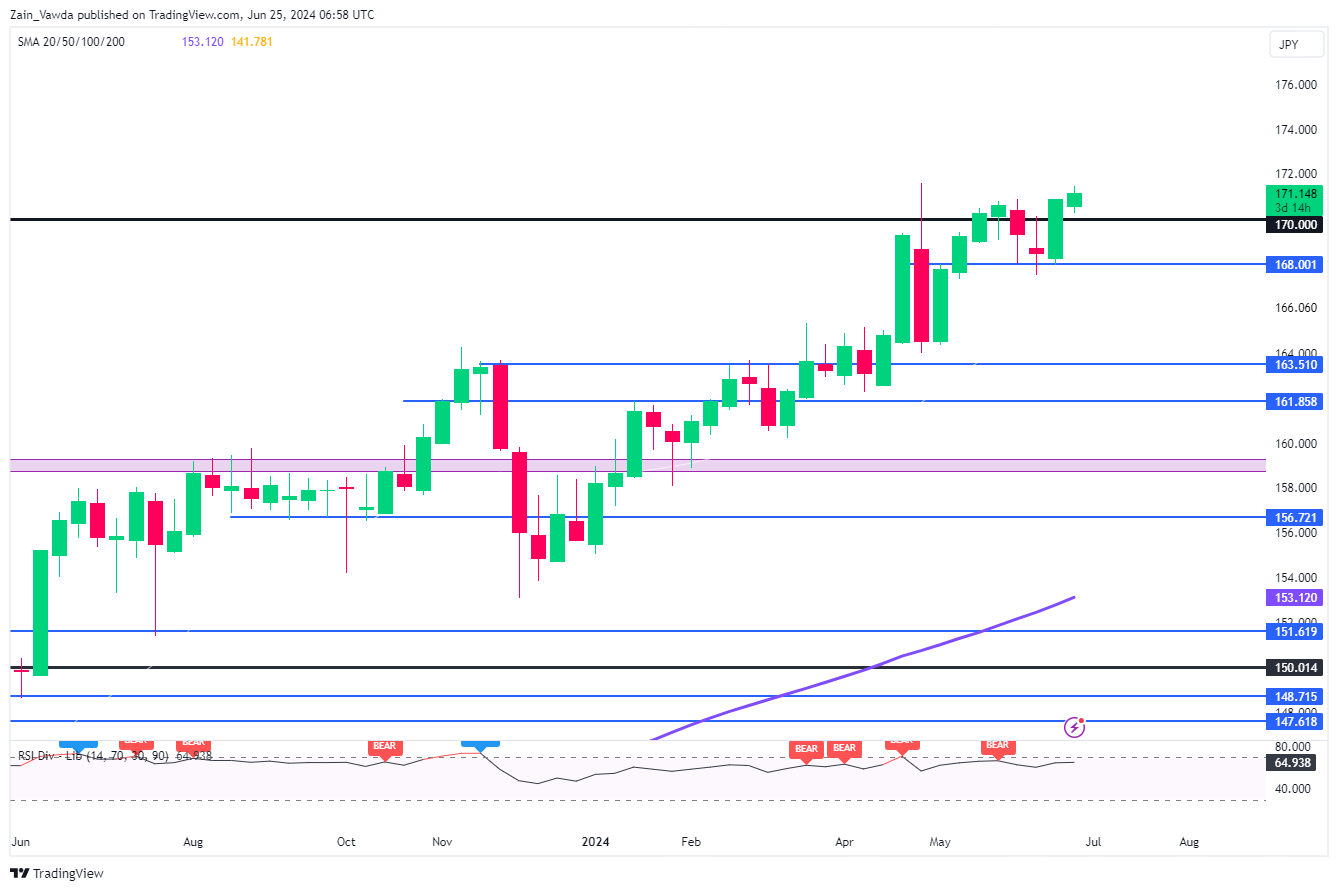
Source: TradingView.Com (click to enlarge)
Dropping down to a daily timeframe and similar to USD/JPY, there is not much in terms of recent or historical price data above the 170.00 handle. Thus looking at the technical should EUR/JPY continue higher may prove challenging.
A retracement from here however, first has to navigate the 170.00 resistance now turned support area, before focus turns to the 168.00 handle and the 100-day MA at 165.63.
EUR/JPY Daily Chart – June 25, 2024
Source: TradingView.Com (click to enlarge)
GBP/JPY
The Weekly timeframe on GBP/JPY echoes its counterparts with a bullish engulfing candle to round out last week. The weekly candle also closed convincingly above the 200.00, having done so only once previously (last week of May). This could prove significant with the engulfing candle hinting at some upside in the week ahead.
GBP/JPY Weekly Chart – June 25, 2024
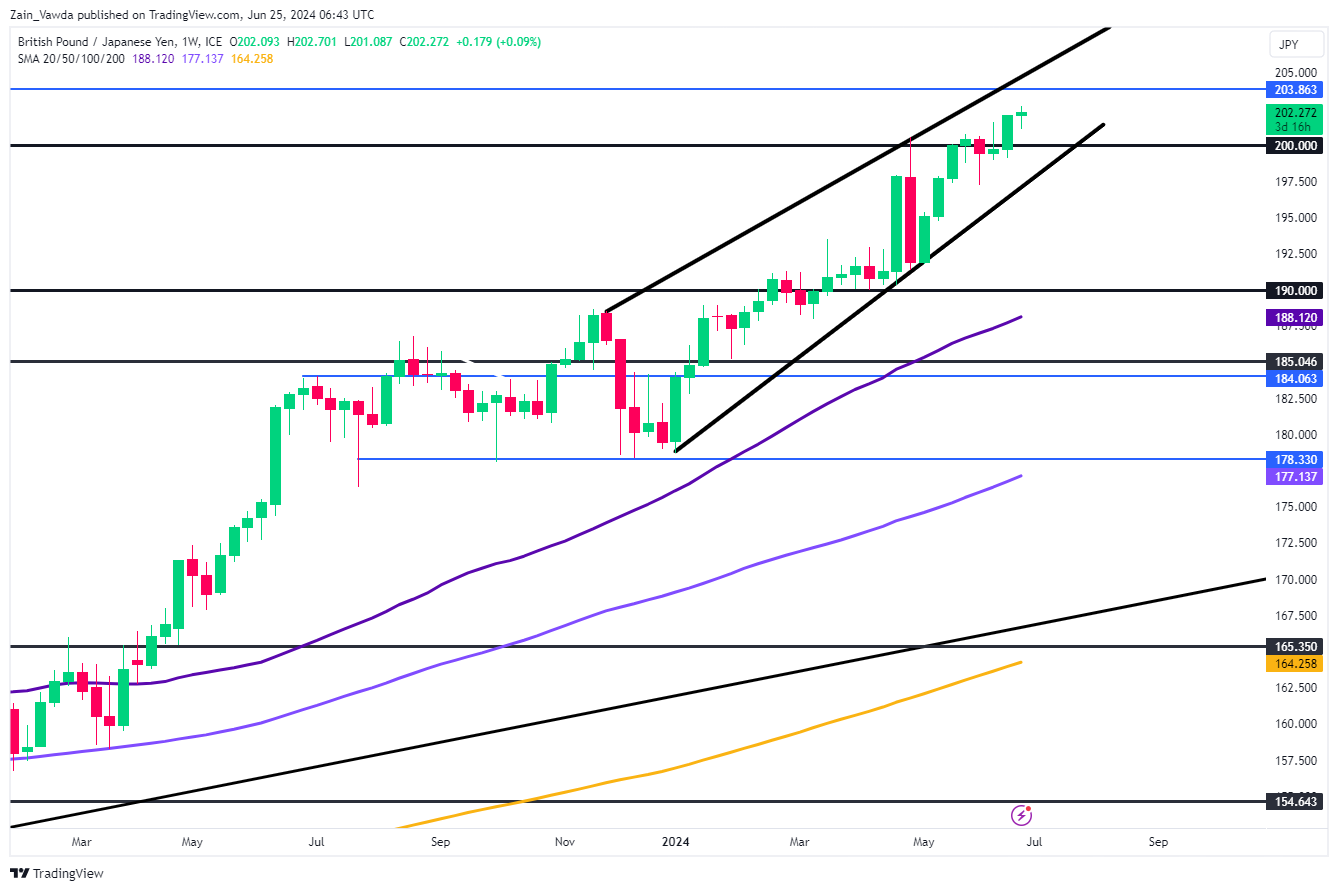
Source: TradingView.Com (click to enlarge)
The key difference between EUR/JPY, USD/JPY and GBP/JPY is that the latter actually has some historic price action we may gauge above the 200.00 handle. Having taken a comprehensive look, immediate resistance rests at 203.86 before the psychological 205.00 handle comes into focus.
There is also a rising wedge formation in play, a break of which could lead to an extended move to the downside. A breach of 200.00 opens up a retest of the 50-day MA which rests toward the lower end of the wedge around 197.50, with the 100-day further down at 193.90.
GBP/JPY Daily Chart – June 25, 2024
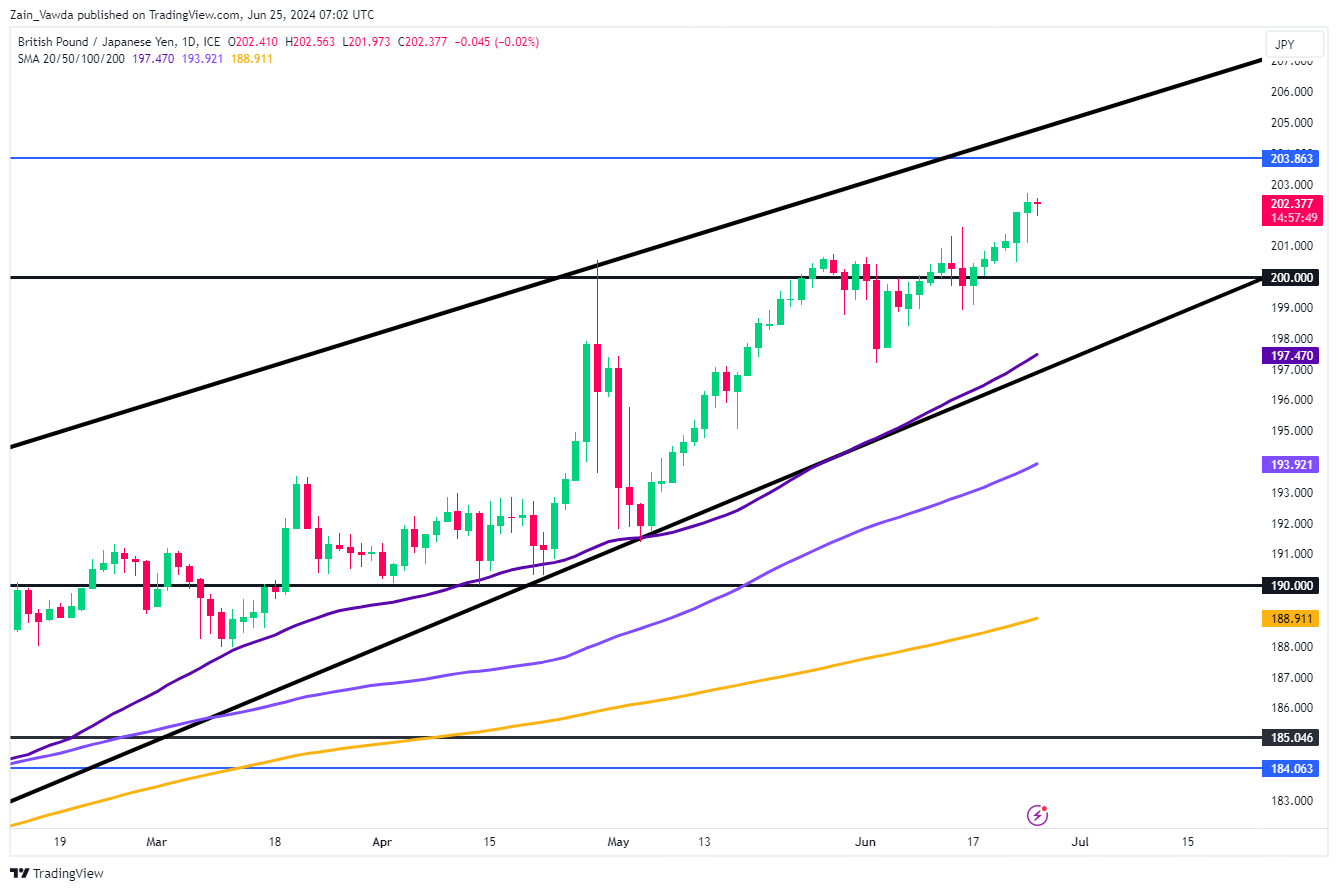
Source: TradingView.Com (click to enlarge)