
Key Highlights
- Gold declined and tested the $2,315 zone.
- A key declining channel is forming with resistance at $2,345 on the 4-hour chart.
- EUR/USD is holding gains above the 1.0850 level.
- GBP/USD seems to be aiming for more gains above 1.2800.
Gold Price Technical Analysis
Gold prices started a fresh decline from the $2,450 resistance against the US Dollar. It traded below the $2,380 level to move into a short-term bearish zone.
The 4-hour chart of XAU/USD indicates that the price settled below the $2,350 level, the 100 Simple Moving Average (red, 4 hours), and the 200 Simple Moving Average (green, 4 hours).
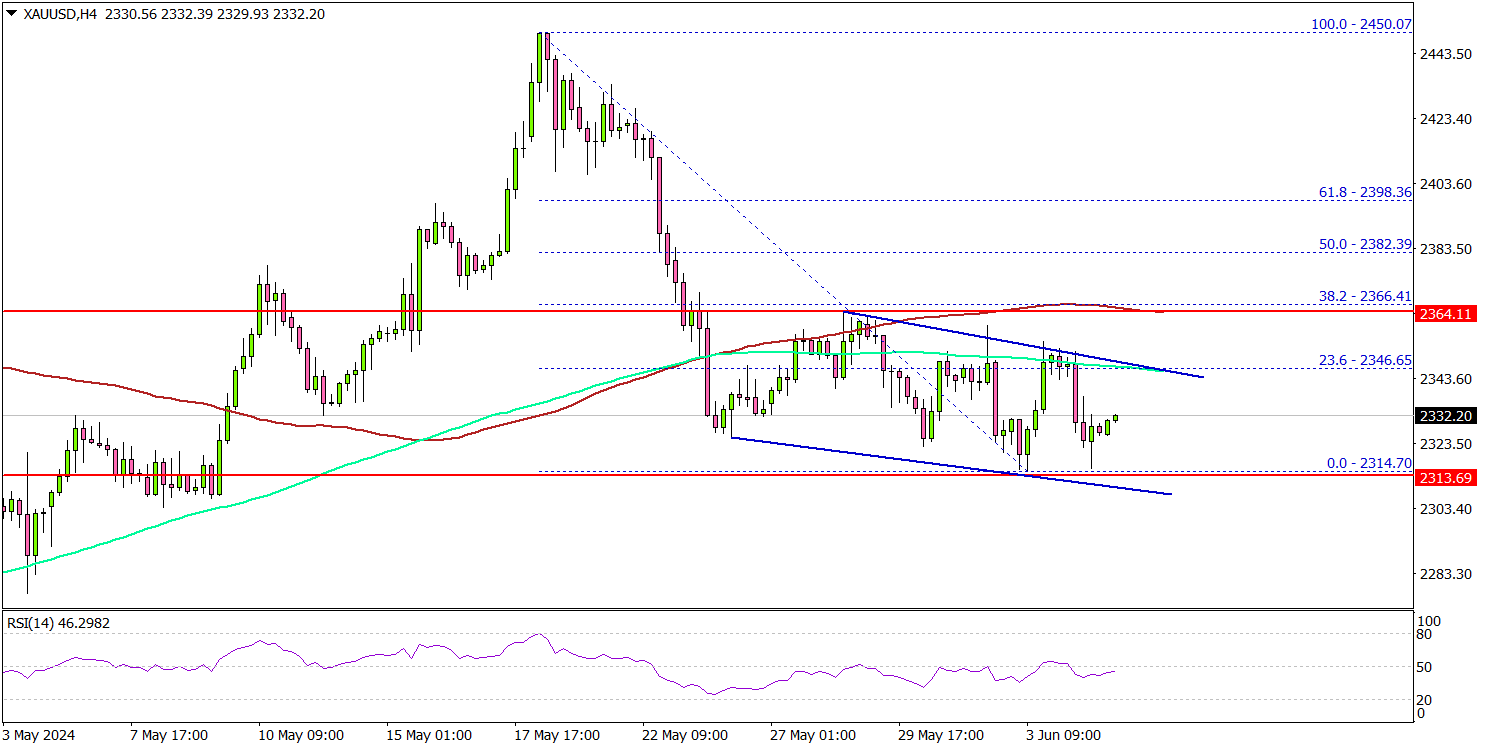
It traded as low as $2,315 and is currently consolidating losses. On the downside, there is a key support forming near the $2,315 level. A downside break below the $2,315 support might call for more downsides.
The next major support is near the $2,300 level. Any more losses might send Gold prices toward $2,280. On the upside, immediate resistance is at $2,340.
The first major resistance is now near $2,345. There is also a key declining channel forming with resistance at $2,345 on the same chart, above which the price could accelerate higher toward the $2,380 level.
Looking at Oil, the bears are still in control, and they could aim for another decline unless there is a move above the $75.00 resistance in the near term.
Economic Releases to Watch Today
- US ISM Services Index for May 2024 – Forecast 50.5, versus 49.4 previous.
- US ADP Employment Change April 2024 – Forecast 173K, versus 192K previous.