
Bullish Scenario: Buying above 4980 with TP1: 4993, TP2: 5005, and TP3: 5014 (Intraday levels). TP (Swing Trading): 5031.90, 5045.66, and 5054. It is recommended to set a stop loss (S.L.) below 4965 or at least 1% of the account capital**.
Bearish Scenario: Selling below 4960 with TP1: 4935, TP2: 0.6487, and TP3: 4924 (Intraday levels). TP (Swing Trading): 4910 and 4865. It is recommended to place a stop loss above 4975, at least 1% of the account capital**. A trailing stop can be used.
The high valuation of indices has been driven since the last quarter of the year by expectations that the Fed would cut rates early in the first quarter of 2024. Subsequently, with the start of the fourth-quarter earnings season of 2023, the optimism and momentum of technology companies have almost exclusively led the rally to new historic highs. Today, Nvidia, the last of the high-cap technology companies, publishes results with very high expectations that could either renew the indices’ momentum to continue the bullish phase or, conversely, extend corrections in the event of results below market expectations. In this analysis, we address possible scenarios from the perspective of liquidity with volume profile and price action.
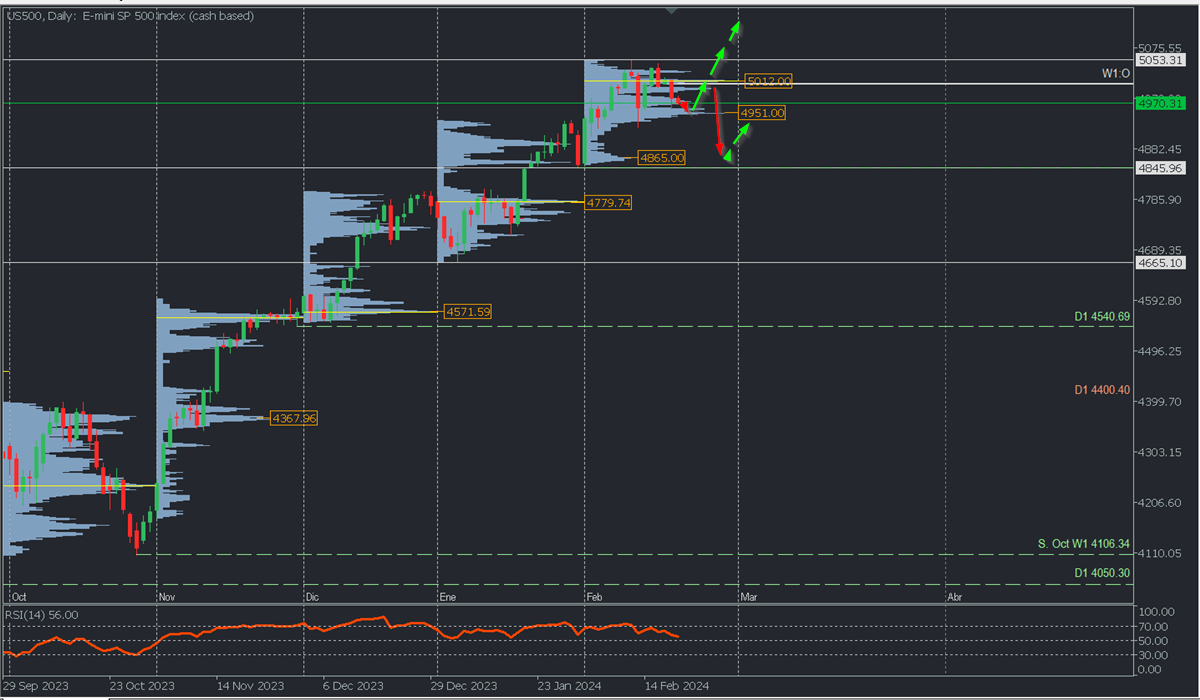
Analysis from the daily chart. Volume Profile and Structure.
The US500 continues in an uptrend, leaving the last resistance and historical high at 5053.31 on February 12th, trading below a high volume concentration zone or POC* around 5012, which coincides with the week’s opening. The high volume node around 4951 represents a support from where bulls could trigger a new price rally seeking to break the macro selling zone around 5012 and thereby possibly breaking the resistance at 5053.31 to extend purchases towards the new psychological level at 5100.
On the other hand, a decisive breakthrough below 4951/50 will pave the way for a more extensive correction towards 4865, the origin buying zone of the February rally. The last support of the uptrend is located at 4844.60.
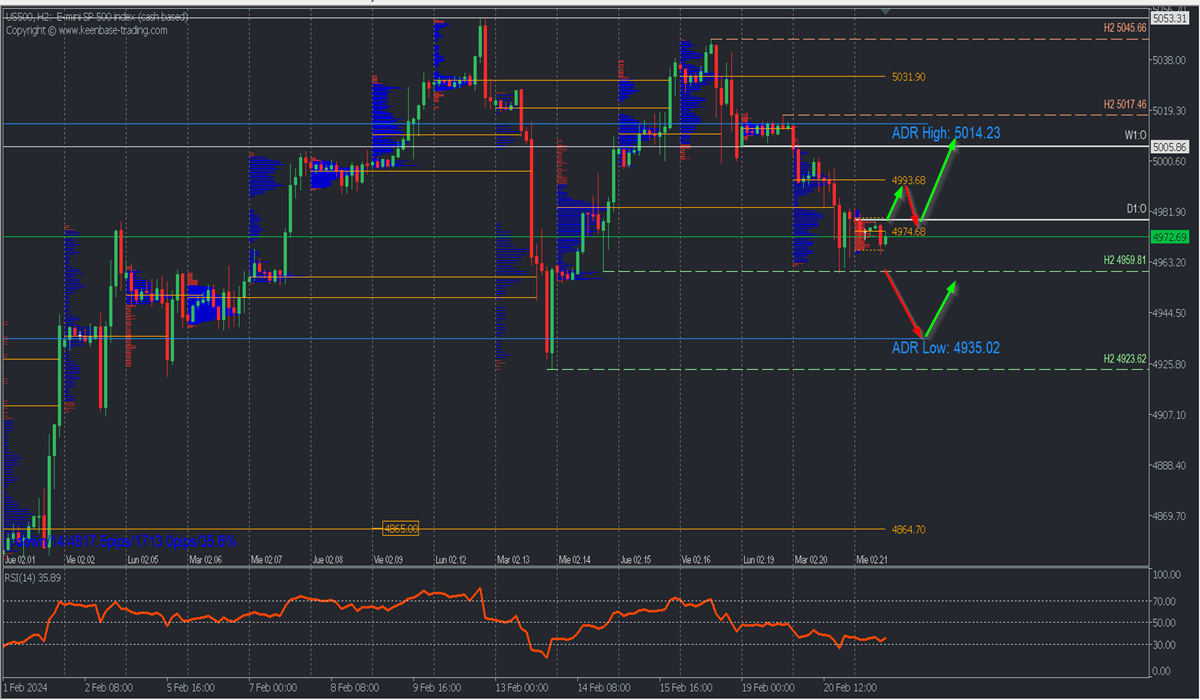
Scenario from the H2 chart:
The bearish correction reached support at 4959.81 with a moderate bullish reaction that could extend if quotes decisively surpass the POC of the first sessions of the day at 4974.68 and of course the day’s opening, paving the way for more purchases with the target at yesterday’s uncovered POC* at 4993.68, a selling zone that on initial touch may provoke a retreat as previously positioned bears defend it.
However, after a second touch, a decisive breakthrough is likely to occur, taking quotes towards the week’s opening at 5005.86 and the daily bullish average range at 5014.23, a scenario that will remain valid as long as quotes do not break the support at 4959.81, in which case we will see the extension of the bearish correction at least towards the bearish average range at 4935.02. The RSI in negative territory could bounce from oversold to the midpoint, confirming not only the bearish momentum but also its temporary exhaustion.
*Uncovered POC: POC = Point of Control: It is the level or zone where the highest volume concentration occurred. If there was a bearish movement from it previously, it is considered a selling zone and forms a resistance zone. On the contrary, if there was a bullish impulse previously, it is considered a buying zone, usually located at lows, forming support zones.
**Consider this risk management suggestion
**It is imperative that risk management is based on capital and traded volume. For this, a maximum risk of 1% of capital is recommended. It is suggested to use risk management indicators such as the Easy Order.