I don’t know about where you are, but the cheap petrol cycles seem to be getting shorter here in Sydney. Taking a look at the price of oil pushing up against higher time frame resistance, it’s not hard to see why.
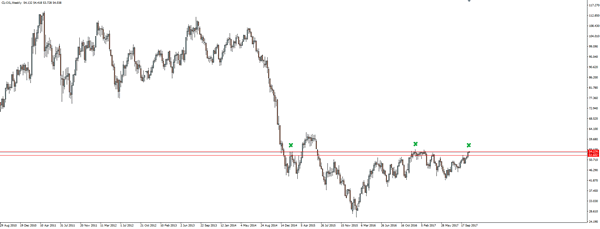
Take a look at the weekly chart for an overview on why this level is so important:
OIL Weekly:

As you can see, price has had multiple touches in the past and has now come back up to test the level again.
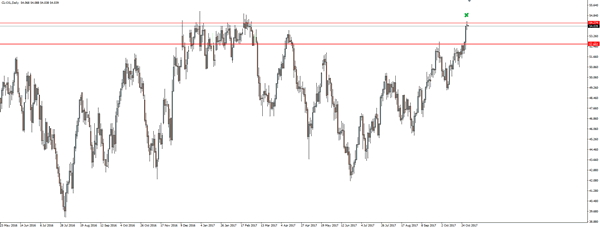
Stepping down one more level, but staying higher time frame with a look at the daily, you can see where price is at more clearly:
OIL Daily:

Something else to start to take notice of is the fact that the latest daily candle is an indecision candle which could be signalling a pending reversal in the near term.
As always, if higher time frame resistance holds, then we’ll zoom into the intraday charts and look for any short term rallies to short into.
