
.)
- The 2-day rebound seen in USD/JPY has reached 146.20/70 minor resistance zone.
- The movement of USD/JPY in the past month has a significant direct correlation with the US 10-year Treasury/10-year JGB yield spread.
- The short-term to medium-term trends of the US 10-year Treasury/10-year JGB yield spread remain bearish.
- Watch the 146.70 key short-term resistance on USD/JPY.
USD/JPY has rebounded and hit the short-term resistance zones of 144.80/145.30 and 146.20/70 as highlighted in our previous analysis reinforced by the better-than-expected US non-farm payrolls data for November and a media report released yesterday, 11 December that stated the Bank of Japan (BoJ) officials were in no rush to scrap short-term negative interest in the upcoming 18 to 19 December monetary policy meeting according to sources.
This latest set of “BoJ’s monetary policy thought process” reported by the media contrasted with the hawkish remarks made by BoJ Governor Ueda and Deputy Governor Himino last week that increased market speculations that the decade-plus of short-term negative interest rate policy in Japan may be scrapped sooner than expected.
The USD/JPY extended its gains from last Friday and rallied by +0.86% to print an intraday high of 146.59 as seen in yesterday’s 11 December US session on the backdrop of the media report.
It’s all about the yield spread between the US 10-year Treasury & 10-year JGB
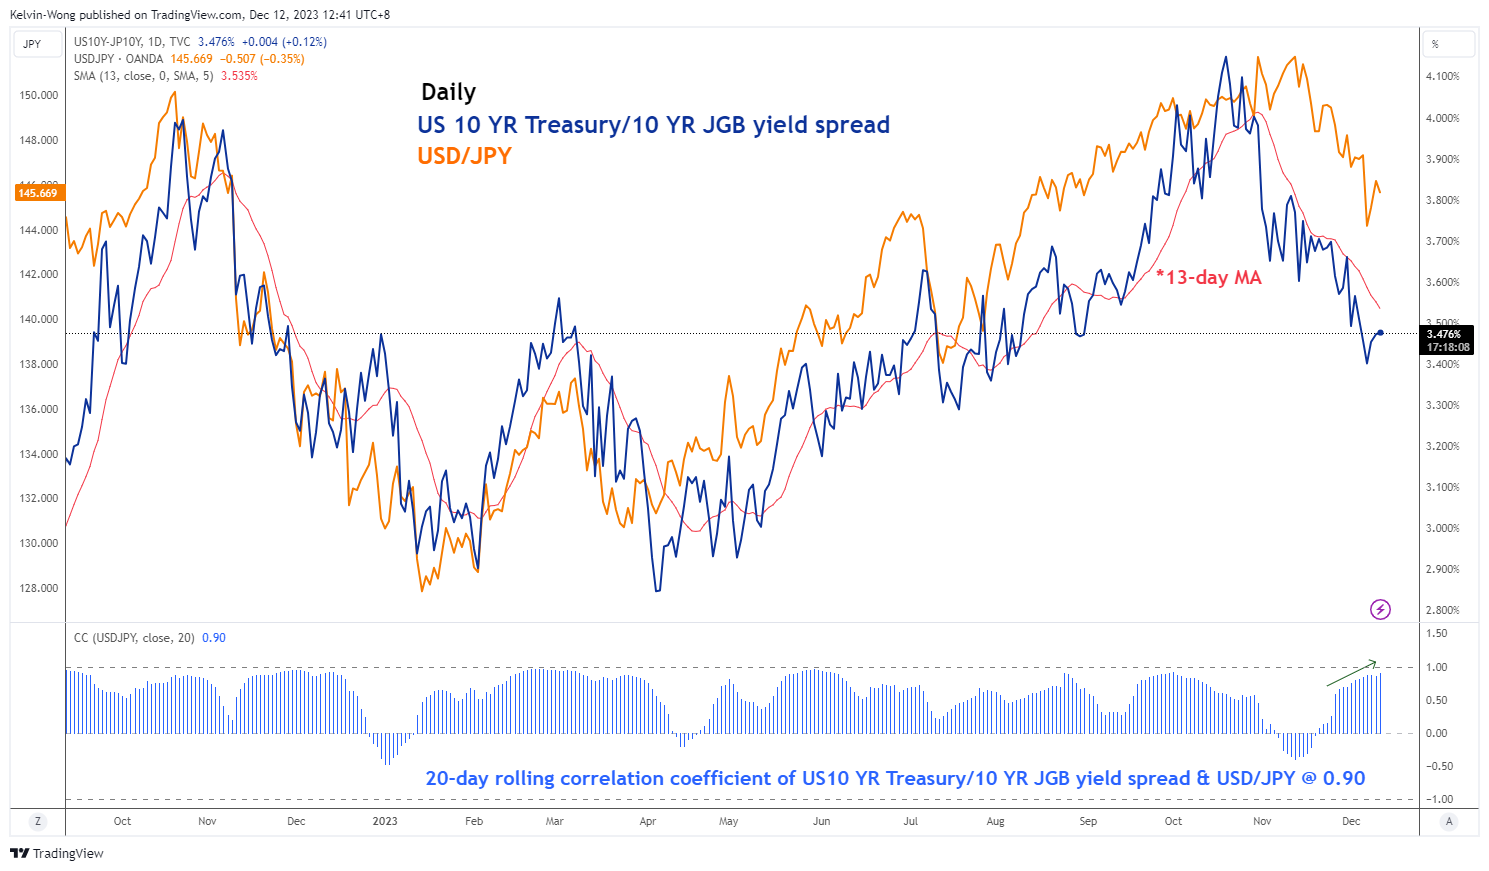
Fig 1: Movement of USD/JPY and US 10-year Treasury/10-year JGB yield spread as of 12 Dec 2023 (Source: TradingView, click to enlarge chart)
Interestingly, the movement of the USD/JPY in the past month has moved in sync with the yield spread of the US 10-year Treasury/10-year Japanese government bonds (JGB) which can be considered as an indirect summation net effect of monetary policy guidance from the Fed and BoJ.
Their current 20-day rolling correlation coefficient is at 0.90 which suggests that the movement of the US 10-year Treasury/10-year JGB yield spread has a significant direct influence on the movement of the USD/JPY.
If the US 10-year Treasury/10-year JGB yield spread compressed (inched downwards), the movement of the USD/JPY reflected a similar directional move on the downside and vice versus if the yield spread expanded to the upside.
Overall, the short to medium-term trend phases of the US 10-year Treasury/10-year JGB yield spread is still bearish as it continues to trend below its downward sloping 13-day moving average. Hence, it may put further downside pressure on the USD/JPY.
USD/JPY’s recent minor rally may have exhausted
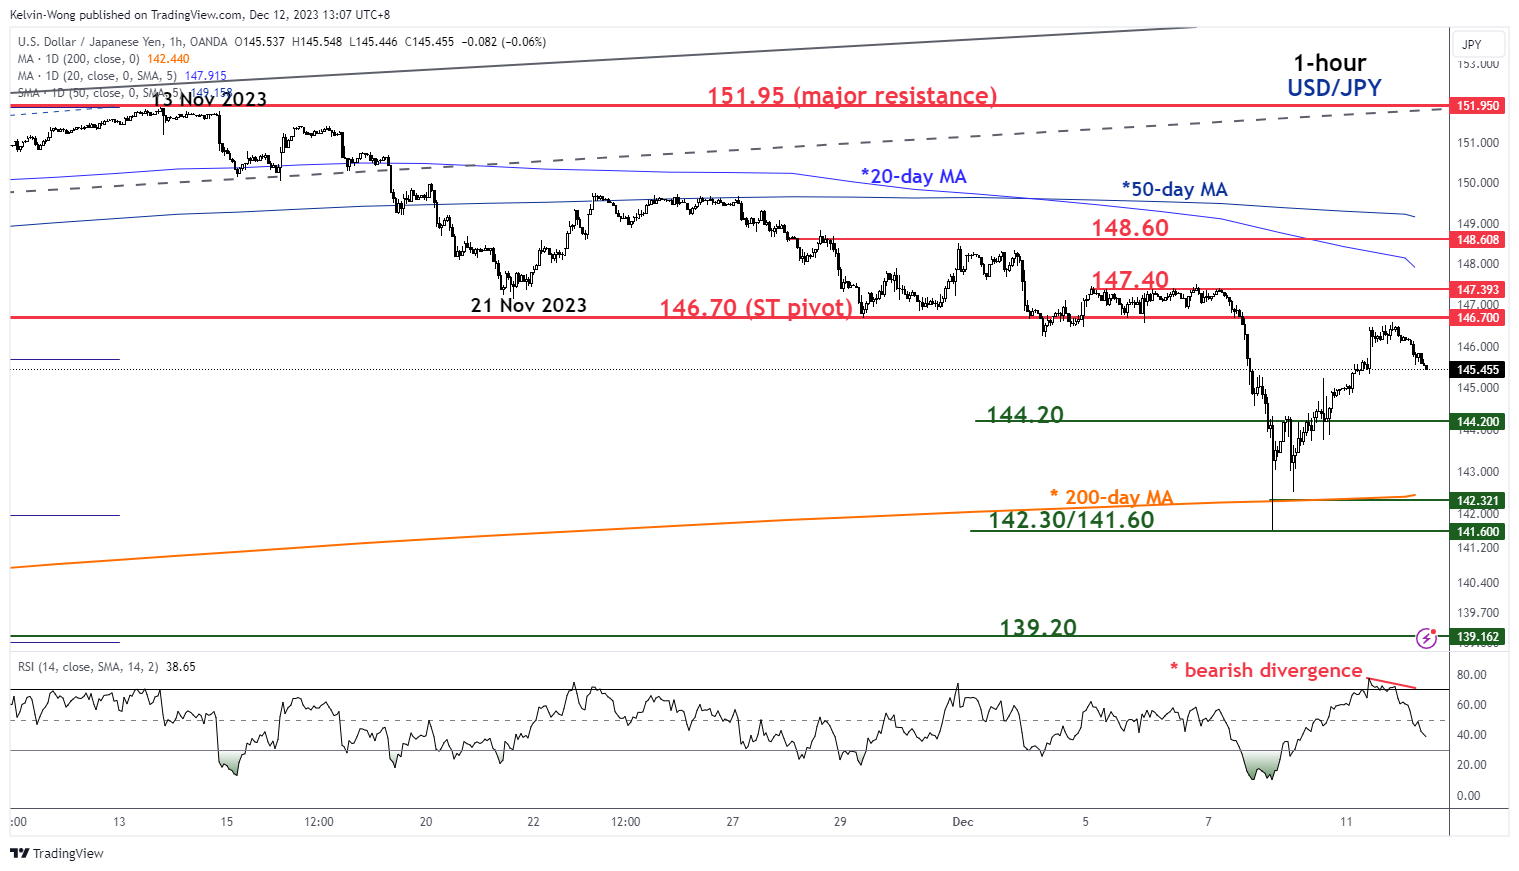
Fig 2: USD/JPY short-term minor trend as of 12 Dec 2023 (Source: TradingView, click to enlarge chart)
The price actions of the USD/JPY have staged a bearish reaction after 2-day of counter-trend rebound at the 146.70 short-term pivotal resistance (former minor swing lows area of 4/5 December 2023 & 50% Fibonacci retracement of the prior minor downtrend phase from 13 November 2023 high to 7 December 2023 low).
In addition, the hourly RSI momentum indicator has flashed out a bearish divergence condition at its overbought condition during yesterday’s US session which suggests that the bullish momentum of the 2-day rally is likely to be exhausted.
Near-term support will be at 144.20 and a break below it exposes the next intermediate support zone of 142.20/141.60 (coincides with the 200-day moving average).
On the flip side, a clearance above 146.70 sees a potential extension of the counter-trend rebound towards the medium-term resistance zone of 147.40/148.60 (coincides with the downward sloping 20 and 50-day moving averages).