
Chinese Yuan’s significant selloff in Asian session today had a ripple effect across several major currencies, dragging down Japanese Yen, Australian Dollar, and New Zealand Dollar. This movement was largely spurred by concerning data from China indicating deepening deflation, which also negatively impacted Hong Kong’s stock market. Yuan’s future trajectory now hinges critically on a series of Chinese economic data scheduled for release later this week, making it a focal point for market analysts and investors in the region.
Meanwhile, Euro, Dollar, and Swiss Franc emerged as the stronger currencies in the current environment, whereas British Sterling and Canadian Dollar exhibited mixed performance. Today’s trading might see subdued activity due to the empty economic calendar in both Europe and North America. However, this lull is expected to be temporary, as the week is set to gain momentum in volatility with four major central bank meetings on the horizon, accompanied by a substantial influx of economic data from various regions.
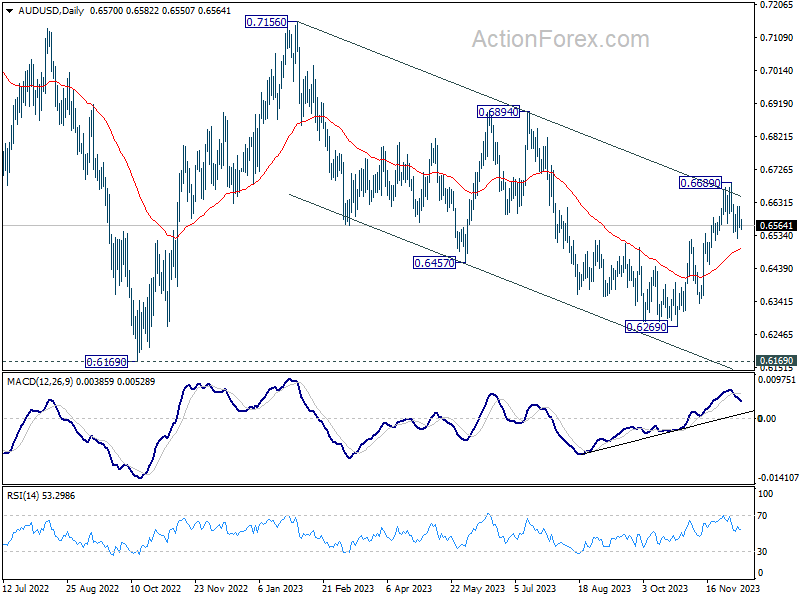
From a technical analysis perspective, AUD/USD is a currency pair that warrants close attention this week. Initial resistance was seen when the pair hit medium term falling channel from 0.7156. Yet, the subsequent pull back is relatively shallow, thus still keeping the rally from 0.6269 alive. However, sustained break of 55 D EMA (now at 0.6494) will argue that the rebound has completed, and down trend from 0.7156 is ready to resume.
In Asia, Nikkei rose 1.50%. Hong Kong HSI is down -1.18%. China Shanghai SSE is up 0.29%. Singapore Strait Times is down -0.65%. Japan 10-year JGB yield rose 0.0063 to 0.780.
China’s CPI fell to -0.5% yoy in Nov, deepening deflation
Released over the weekend, China’s economic data revealed a concerning trend as CPI plunged further into negative territory in November, marking the country’s deepest deflationary period in three years. CPI fell to -0.5% yoy, a notable decline from -0.2% yoy in the previous month and falling short of the expected -0.2% yoy. This deflationary reading is the most significant since November 2020, indicating mounting economic pressures. Core CPI, which excludes volatile items such as food and fuel, remained stable at 0.6% yoy, mirroring October’s figures.
National Bureau of Statistics chief statistician, Dong Lijuan, highlighted that the overall decline was driven primarily by decrease in energy and food prices. In particular, food prices dropped by -4.2% yoy, significantly impacted by a sharp -31.8% yoy decrease in pork prices. Meanwhile, non-food prices saw a modest increase of 0.4% yoy, with services prices climbing by 1.0% yoy.
On a month-on-month basis, CPI also experienced a downturn, falling by -0.5% mom in November from the previous month. This decline was characterized by a -0.9% drop in food prices and a -0.4% decrease in non-food prices.
From January to November, the average CPI increase was a mere 0.3% yoy, starkly undershooting China’s set annual inflation target of around 3%.
Furthermore, PPI also recorded a downturn, declining by -3.0% yoy, which is worse than the prior month’s -2.6% yoy and below the anticipated -2.8% yoy. This marks the 14th consecutive month of negative PPI readings, the worst since August.
USD/CHN sets sight on 7.2 as rebound from fibonacci support extends
Chinese Yuan weakens notably in Asian session today, setting its sights on crossing the 7.2 mark against Dollar. This movement is largely attributed to deepening deflation in consumer and factory prices in China, exerting downward pressure on the Yuan. Concurrently, Dollar is still riding the tailwind generated by last week’s robust job data.
A key question for Yuan is whether its extended decline, which began in January this year, concluded in September. And, if Yuan is now in a medium-term up trend that’s set to extend through 2024.
Some economists remain cautious about the currency’s prospects, pointing to the prolonged downturn in China’s housing market and consumer spending as significant drags on its value. Further impacting Yuan is the ongoing “de-risking” efforts by multinational corporations. These firms are increasingly adopting a “China+” strategy, diversifying their operations by adding plants and facilities in other countries, thereby diverting investments away from China. Moreover, these companies are likely to continue repatriating earnings, driven by China’s relatively low interest rates, which could further depress Yuan.
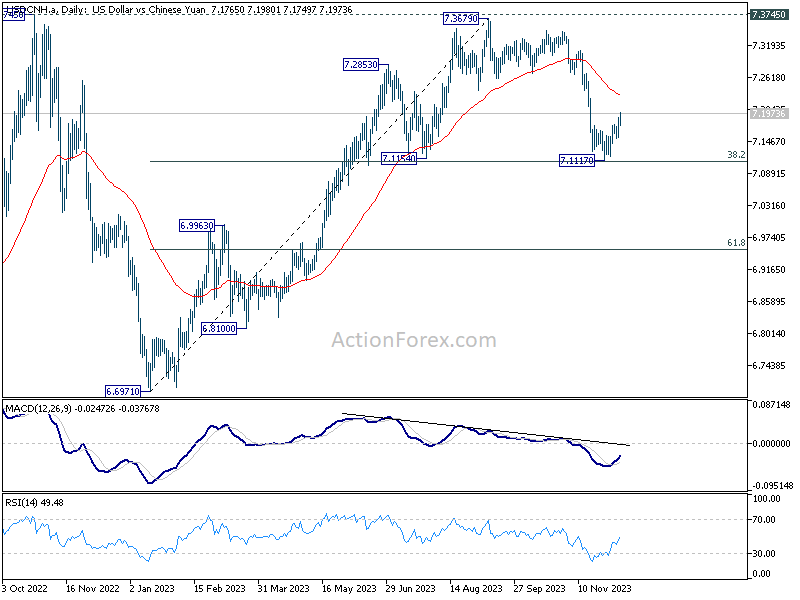
From a technical perspective, it remains to be confirm is USD/CNH’s fall from 7.3679 is a correction to the up trend from 6.6971, or reversing it.
The notable rebound from 7.1154 cluster support (38.2% retracement of 6.6971 to 7.3679 at 7.1117) is favoring the former case. Even so, sustained break of 55 D EMA (now at 7.2311) is needed to confirm completion of the pull back, and bring retest of 7.3679/3745 resistance zone.
On the other hand, sustained break of 7.1117/54 will favor the latter case of bearish trend reversal, and target 61.8% retracement at 6.9533 and below.
USD/CNH’s trajectory is not only crucial in understanding the Yuan’s movements but also serves as a valuable guide for USD/JPY. Additionally, it acts as a secondary indicator for the strength or weakness of AUD/USD.
Bitcoin and Ether undergo sudden pullback as consolidation phase commences:
The cryptocurrency markets saw a sharp downturn in today’s Asian session. The decline doesn’t seem to be triggered by any specific event and might be amplified by the typically low liquidity on Mondays in the Asian markets. Another contributing factor could be profit-taking by traders following a recent strong bull run, especially with the impending FOMC rate decision looming on Wednesday.
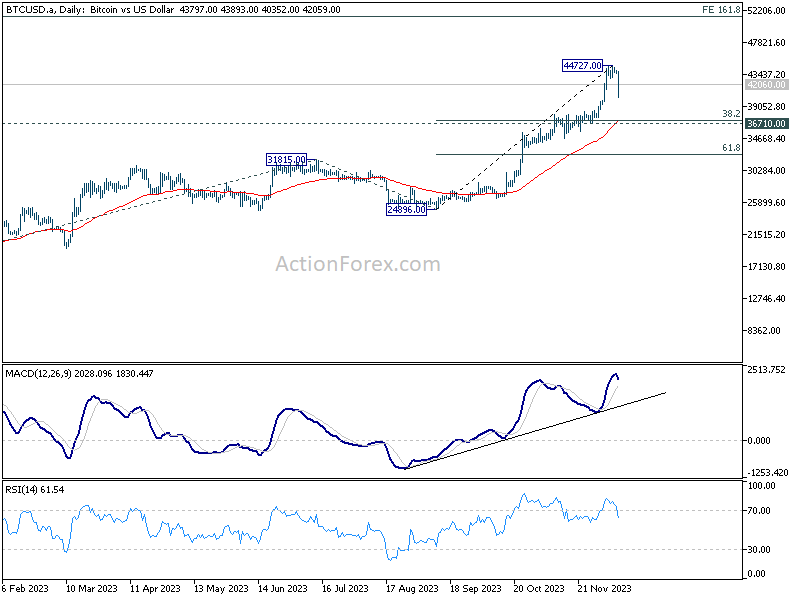
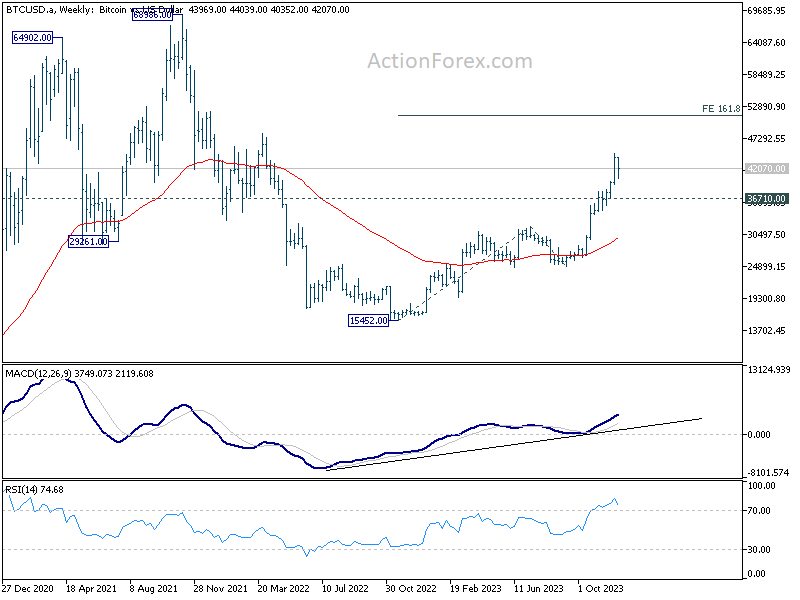
Technically speaking a short term top should be in place at 44727 in Bitcoin. Consolidations should follow in the near term, and deeper pull back cannot be ruled out. But downside should be contained by 36710 cluster support (38.2% retracement of 24896 to 44727 at 37151) to bring rebound. Larger uptrend from 15452 is expected to resume at a later stage.
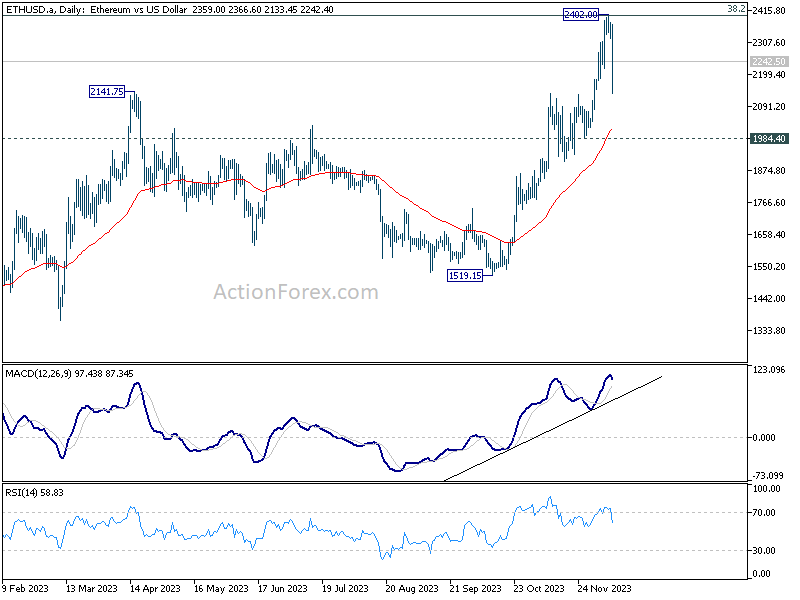
As for Ethereum, a short term top is in place at 2402, and more consolidative trading would be seen in the near term. There is risk of deeper pull back from outlook will stay cautiously bullish as long as 1984.4 support holds, which is close to 55 D EMA (now at 2017).
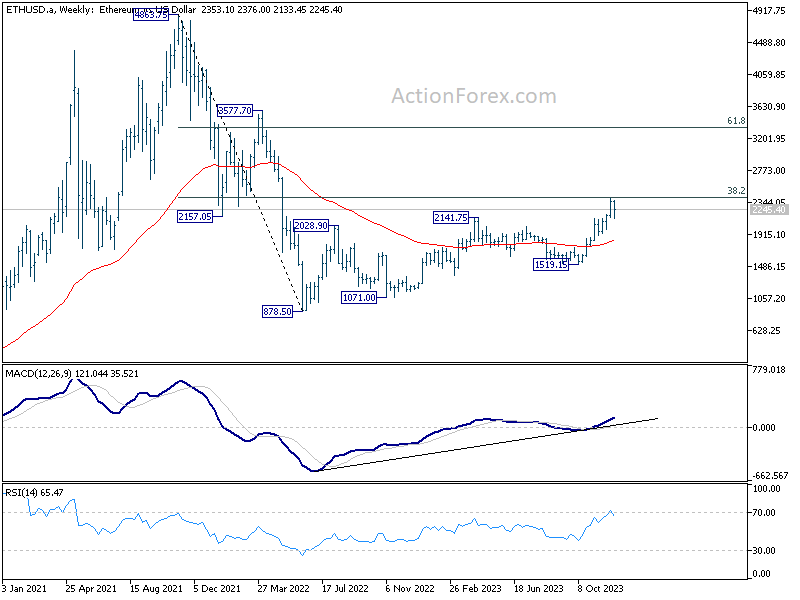
However, the larger outlook of Ethereum is less bullish, as it’s just capped by 38.2% retracement of 4863.7 to 878.5 at 2400. Break of above mentioned 1984.4 support will indicate rejection by 2400 fibonacci level, and keeps medium term outlook neutral at best.
A week of high stakes: Central bank frenzy and a wave of economic data on the horizon
The global financial markets brace for a series of policy decisions from the world’s leading central banks and a deluge of key economic data releases. Central to this week’s economic narrative is FOMC meeting, coupled with policy announcements expected from SNB, BoE, and ECB.
The consensus anticipates Fed will maintain interest rates unchanged at 5.25-5.50%. The center of attention, however, is directed towards the updated “dot plot,” a graphical representation of the individual FOMC members’ interest rate projections.
The previous median projection in September pointed towards an increase in the federal funds rate to 5.625% by the close of this year, with a majority of 12 out of 19 FOMC members in agreement. Given the improbability of another rate hike in the current meeting, a crucial question looms: Will the forthcoming dot plot eliminate the prospect of additional rate increases, or simply defer them to the next year?
Another critical aspect to watch is the projected pace of monetary policy relaxation in 2024. Earlier projections indicated reduction in federal funds rate to 5.125% by the end of the upcoming year. This projection, however, was marked by a wide array of predictions, with the most hawkish member forecasting a rate of 6.125%, while the most dovish estimates hovered at 4.375%. The revised pace of rate cuts will be instrumental in signaling the timing for the onset of policy easing.
Globally, SNB, BoE, and ECB are also anticipated to maintain their monetary policies unchanged. The overarching message likely to emanate from these institutions is a continued commitment to combating inflation, highlighting that it is too soon to contemplate rate cuts. Meanwhile, SNB’s forthcoming conditional inflation forecast, ECB’s latest economic projections, and BoE’s voting pattern will offer valuable insights, potentially swaying market sentiments.
Moreover, the week is packed with a barrage of important economic data releases across the globe, which are poised to have significant ramifications on the markets. Some important ones include US CPI, German ZEW economic sentiment, UK GDP and employment, Japan Tankan survey, Australia employment, New Zealand GDP, and a batch of data from China including industrial production and retail sales. The release of global flash Purchasing Managers’ Index (PMI) data on Friday will further enrich this data trove.
Here are some highlights of the busy week:
- Monday: Japan BSI manufacturing index, machine tool orders.
- Tuesday: Australia Westpac consumer confidence, NAB business confidence; Japan PPI; UK employment; German ZEW economic sentiment; US CPI.
- Wednesday: New Zealand current account; Japan Tankan survey; UK GDP, production, trade balance; Swiss SECO economic forecasts; Eurozone industrial production; US PPI, FOMC rate decision.
- Thursday: New Zealand GDP; Australia employment; Japan machine orders; Swiss PPI, SNB rate decision; BoE rate decision; ECB rate decision; Canada manufacturing sales; US retail sales, jobless claims, business inventories.
- Friday: New Zealand BusinessNZ manufacturing; Australia PMIs; Japan PMI manufacturing, tertiary industry index; China industrial production, retail sales, fixed asset investment; Eurozone PMIs, trade balance; UK PMIs; Canada housing starts, wholesale sales; US Empire state manufacturing, industrial production, PMIs.
USD/JPY Daily Outlook
Daily Pivots: (S1) 143.18; (P) 144.20; (R1) 145.89; More…
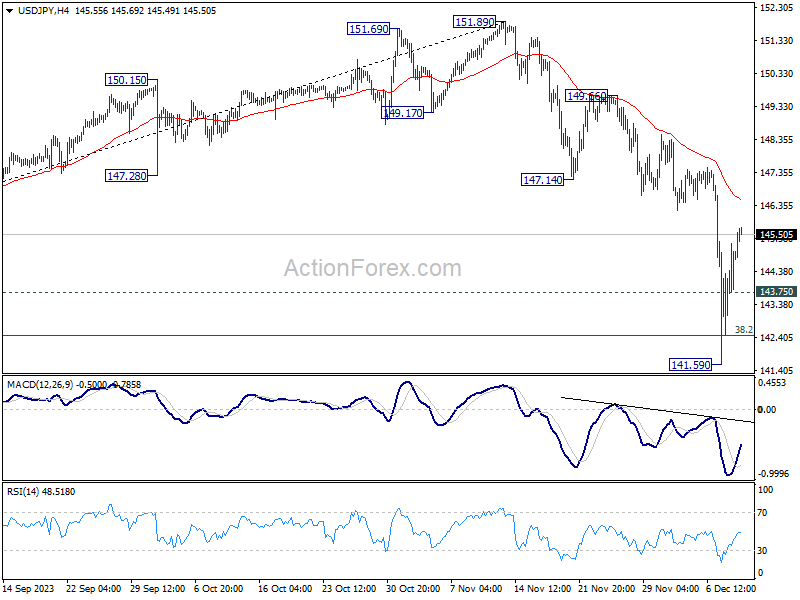
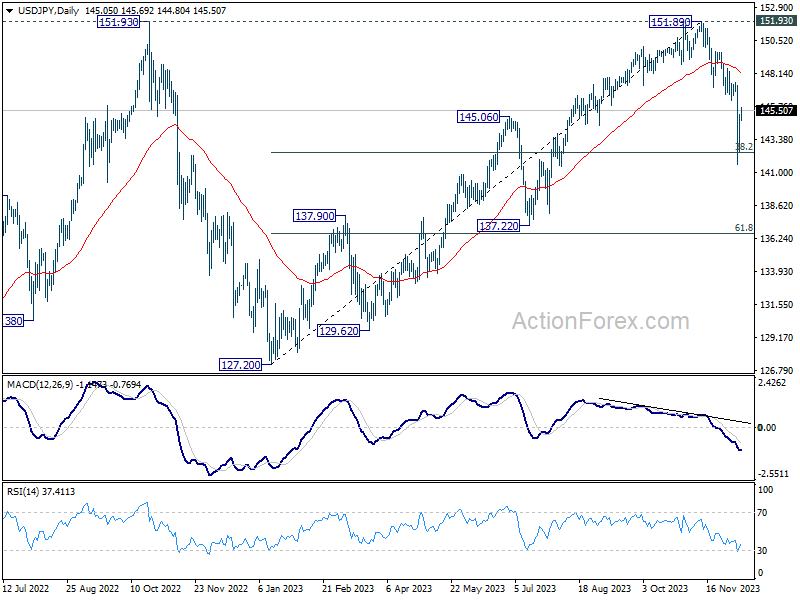
USD/JPY’s recovery from 141.59 continues today, and further rally could be seen. But upside should be limited below 147.14 support turned resistance. On the downside, below 143.75 minor support will turn bias to the downside for retesting 141.59. Break of 141.59 and sustained trading below 142.45 fibonacci level will pave the way to next fibonacci level at 136.63.
In the bigger picture, current fall from 151.89 is seen as the third leg of the corrective pattern from 151.93 (2022 high). Deeper decline would be seen through 38.2% retracement of 127.20 to 151.89 at 142.45 to 61.8% retracement at 136.63. This will now remain the favored as long as 147.14 support turned resistance holds.
Economic Indicators Update
| GMT | Ccy | Events | Actual | Forecast | Previous | Revised |
|---|---|---|---|---|---|---|
| 23:50 | JPY | BSI Large Manufacturing Index Q4 | 5.7 | 5.6 | 5.4 | |
| 23:50 | JPY | Money Supply M2+CD Y/Y Nov | 2.30% | 2.50% | 2.40% | |
| 06:00 | JPY | Machine Tool Orders Y/Y Nov P | -13.60% | -20.60% |