U.S. Highlights
- Consumer Price Index (CPI) inflation printed lower than expected in October, fueling a rally in equities and a sharp pullback in longer-term Treasury yields.
- A government shutdown was averted this week, as Congress passed another short-term funding bill that maintains current spending levels through mid-January.
- Retail sales data showed a moderation in spending activity in October, while higher frequency credit card spend data suggests the weakness has extended into November.
Canadian Highlights
- Next week’s Canadian inflation report is likely to show easing price growth, in line with this week’s U.S. CPI print. The latter was the spark behind a rally in Canadian bonds and equities.
- The fall federal update is also slated for next week, with policymakers promising action on housing supply. On this front, housing starts remained highly elevated in October, though more needs to be done to tackle affordability challenges.
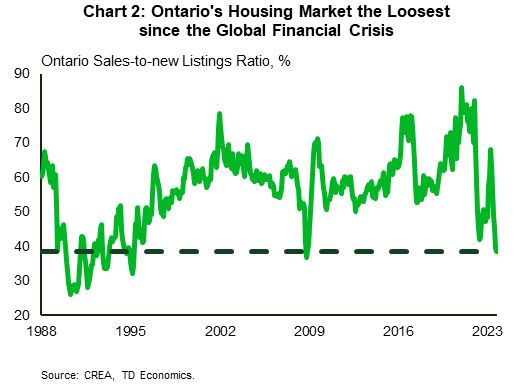
- Given the elevated rates backdrop, Canadian home sales and prices unsurprisingly dropped in October. In Ontario, housing markets are the loosest they’ve been since the Financial Crisis.
U.S. – Extended Fed Pause Looking Increasingly Likely
Market sentiment was decisively in the risk-on camp this week, as a softer reading on October inflation and signs of slowing consumer spending fueled expectations of a longer Fed pause. Also providing a lift to equities was Congress acting to pass yet another short-term funding bill that avoids an immediate government shutdown by extending current levels of spending through mid-January. The S&P 500 is shaping up to end the week 2% higher – extending its winning streak to three-consecutive weeks. Longer-term yields traded lower, with the 10-year Treasury ending the week down 18 basis-points to 4.43%.
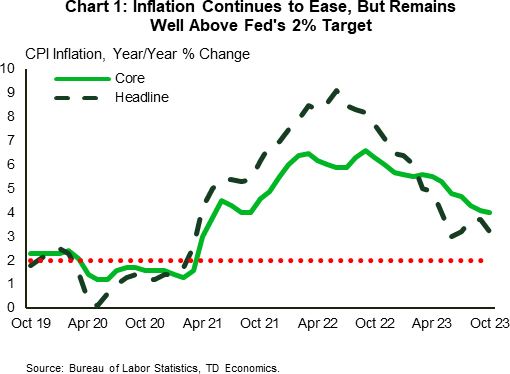
Turning to the Consumer Price Index (CPI) report, both headline and core inflation came in below market expectations. Falling energy and goods prices, a further easing on housing costs and some deceleration in the ‘supercore’ measure all contributed to last month’s softer print. On a twelve-month basis, core inflation is down 2.6 percentage points from last year’s high but, at 4%, remains well above the Fed’s 2% inflation target (Chart 1). As noted in our commentary, the challenge for the Fed going forward is that much of the low hanging fruit on the dis-inflation front has now been picked. With supply-chain issues largely resolved, it is unlikely that falling goods prices will continue to exert as much of a drag on inflation going forward. Ultimately, this means a more pronounced slowing in consumer spending will be required to sustain continued downward pressure on inflation.
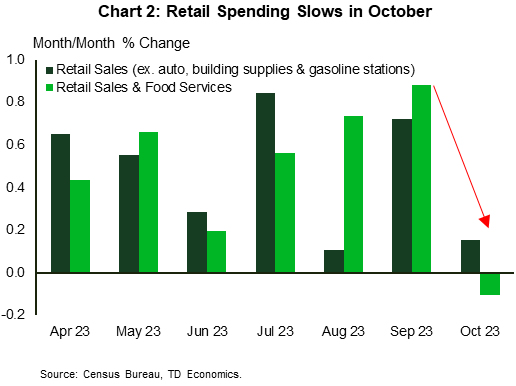
Retail sales data out this week showed that spending activity moderated in October. Although some of the weakness was attributed to a pullback in vehicle sales (possibly impacted by the UAW strike), the less volatile components still showed a meaningful deceleration in spending relative to prior months (Chart 2). Moreover, higher frequency credit card spend data reported through the first week of November has shown that spending activity has continued to moderate into the holiday shopping season.
At this point, the tailwinds for the consumer seem to be fading. Over two-thirds of the excess savings accumulated during the pandemic have now been exhausted, with most of the remaining savings likely residing with higher income households who tend to have a lower marginal propensity to consume. This is happening at a time when 27 million borrowers have started to make regular student loan repayments amidst a backdrop of deteriorating consumer sentiment and expectations of a cooling labor market.
To that end, recent readings on initial jobless claims have already turned higher over the past month, as have continued claims – recently touching a near two-year high. This suggests that not only are more workers losing their jobs but it’s also becoming a bit harder to find another. Ultimately, the labor market remains very tight by historical standards, but the recent drift higher in claims data suggests underlying conditions are easing on the margin. Although the Fed will need to see further evidence of cooling in the months ahead to rule out another rate hike next year, the recent data flow favors the FOMC holding rates steady in December.
Canada – Supply, Supply, Supply
Canadian bond yields were down this week. However, as is often the case, developments south of the border were the driver. Markets seemed to breathe a collective sigh of relief after a softer-than-expected U.S. CPI report offered some hope that the Federal Reserve wouldn’t be taking their policy rate higher in the near-term. This prospect also supported a rally in Canadian equities, even as oil prices continued to drop on demand concerns and a larger-than-expected inventory build. It also helped prop up the Canadian dollar, although at around 0.73 U.S. cents, the loonie continues to fly low compared to its U.S. counterpart.
Next week features the release of the Canadian inflation report for October. U.S. all-items inflation trends have historically been a good guide for overall Canadian CPI, so the good showing stateside this week bodes well for the Canadian print. Specifically, markets expect all-items inflation to have cooled to 3.2% year-on-year in October, a marked deceleration from the heated pace observed during much of the summer. As in the U.S., energy prices should lead the inflation deceleration. However, policymakers will be keying in on core inflation, which is also expected to show some modest cooling in year-on-year terms. Notably, U.S. core inflation (i.e., ex-food and energy) eased a touch in October although the correlation between it and the equivalent Canadian measure isn’t nearly as tight as it is for overall inflation.
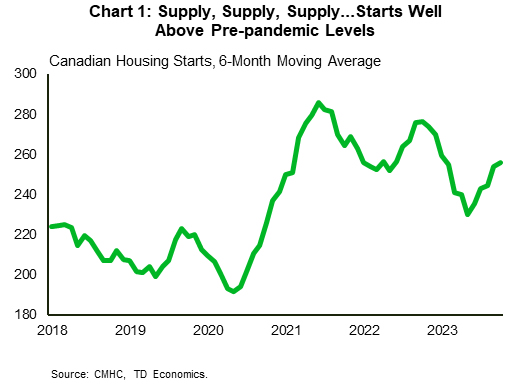
The fall federal fiscal update is also on tap for next week, and the government has telegraphed its intentions. As Minister Freeland noted in a speech this week, the focus will be on housing “supply, supply, supply”, amid Canada’s affordability crisis. Builders are certainly doing their part to respond to this challenge, with this week’s report on housing starts showing them rising to a highly elevated level of 275k units, which is not too far off the record pace hit in early 2021. On a six-month average basis, starts are sitting at a very healthy 253k units (Chart 1), with the largest contributions coming from condos and purpose-built rental construction. While these are good trends indeed, the time it takes to complete a housing project in Canada is on the rise, and even these lofty levels of homebuilding may not be enough to prevent a housing shortage from accumulating given very robust population growth.
From a near-term residential investment and GDP growth perspective, last month’s modest gain in housing starts should provide some offset to the 5% month-on-month decline in October’s Canadian home sales. As expected, average and benchmark home prices pulled back last month, as did new listings. Arguably the most eye-catching aspect of the report was the decline in Ontario’s sales-to-new listings ratio, which hit its lowest level since the Global Financial Crisis (Chart 2). This is a strong signal that more home price declines may be on the way.