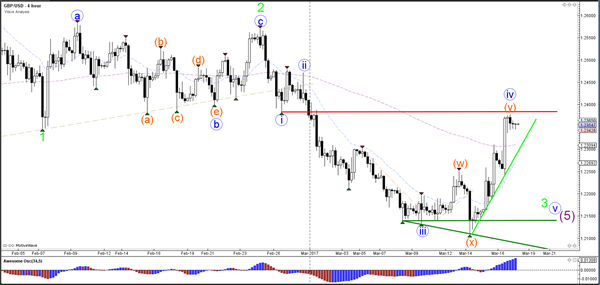
Currency pair GBP/USD
The GBP/USD bullish retracement is not showing any signs of exhaustion. A break above the resistance trend line (red), which is the bottom of wave 1 (blue), would invalidate the wave 4 (blue). In that case, price is probably building an ABC rather than a 123 (green).
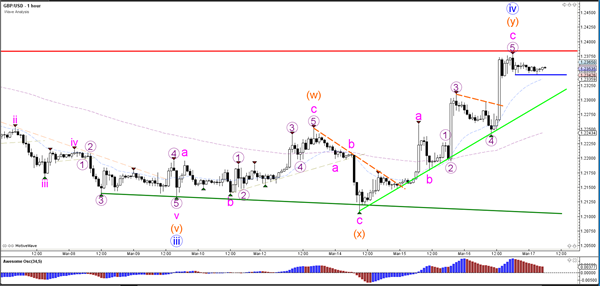
The GBP/USD has reached a critical decision zone where the breakout above resistance (red) or below support (blue/green) would indicate an uptrend or downtrend.
Currency pair EUR/USD
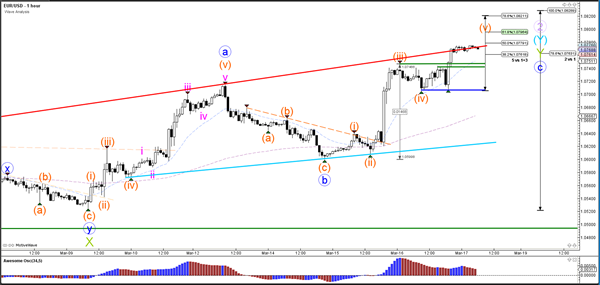
The EUR/USD has reached the 78.6% Fibonacci resistance level of wave 2 (purple). A potential break above the 100% level invalidates the current wave 1-2 (purple) structure. A break below support would confirm a new downtrend within waves 3 (brown/green).
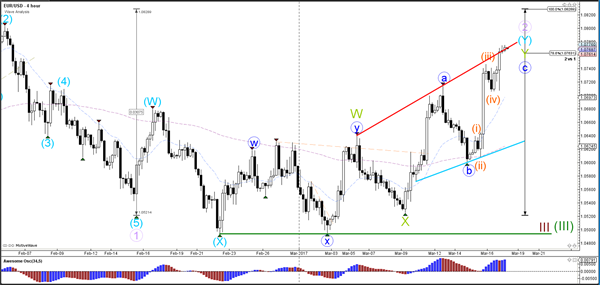
The EUR/USD is facing a resistance trend line (red). A break below the support trend lines (green) could see price test the next support (blue).
Currency pair USD/JPY
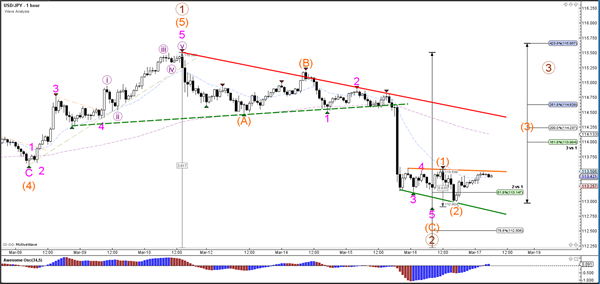
The USD/JPY uptrend stays intact if price manages to stay above the 100% Fibonacci level of wave 2 (blue/brown). The 61.8% and 78.6% Fibonacci levels of wave 2 (brown) are potential support levels.
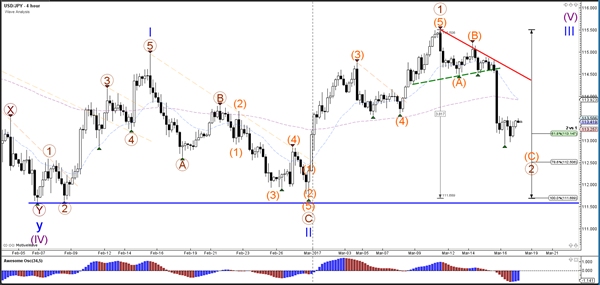
The USD/JPY could be building a bullish turn if price manages to break above resistance (orange).
