
 has staged the bullish breakout above US$1,940 and rallied to an intraday high of US$1,987.53 on 20 July 2023, just a whisker away from the US$1,990 resistance (former congestion support zone from 10 April 2023 to 16 May 2023).)
- Medium-term uptrend of Gold (XAU/USD) remains intact.
- Its recent slide of -1.7% from the 20 July 2023 high of US$1,987.53 has pull-backed close to its 50-day moving average.
- Short-term elements suggest a potential bullish reversal for Gold (XAU/USD) with key support at US$1,939.
Gold (XAU/USD) has staged the bullish breakout above US$1,940 and rallied to an intraday high of US$1,987.53 on 20 July 2023, just a whisker away from the US$1,990 resistance (former congestion support zone from 10 April 2023 to 16 May 2023).
The medium-term uptrend remains intact
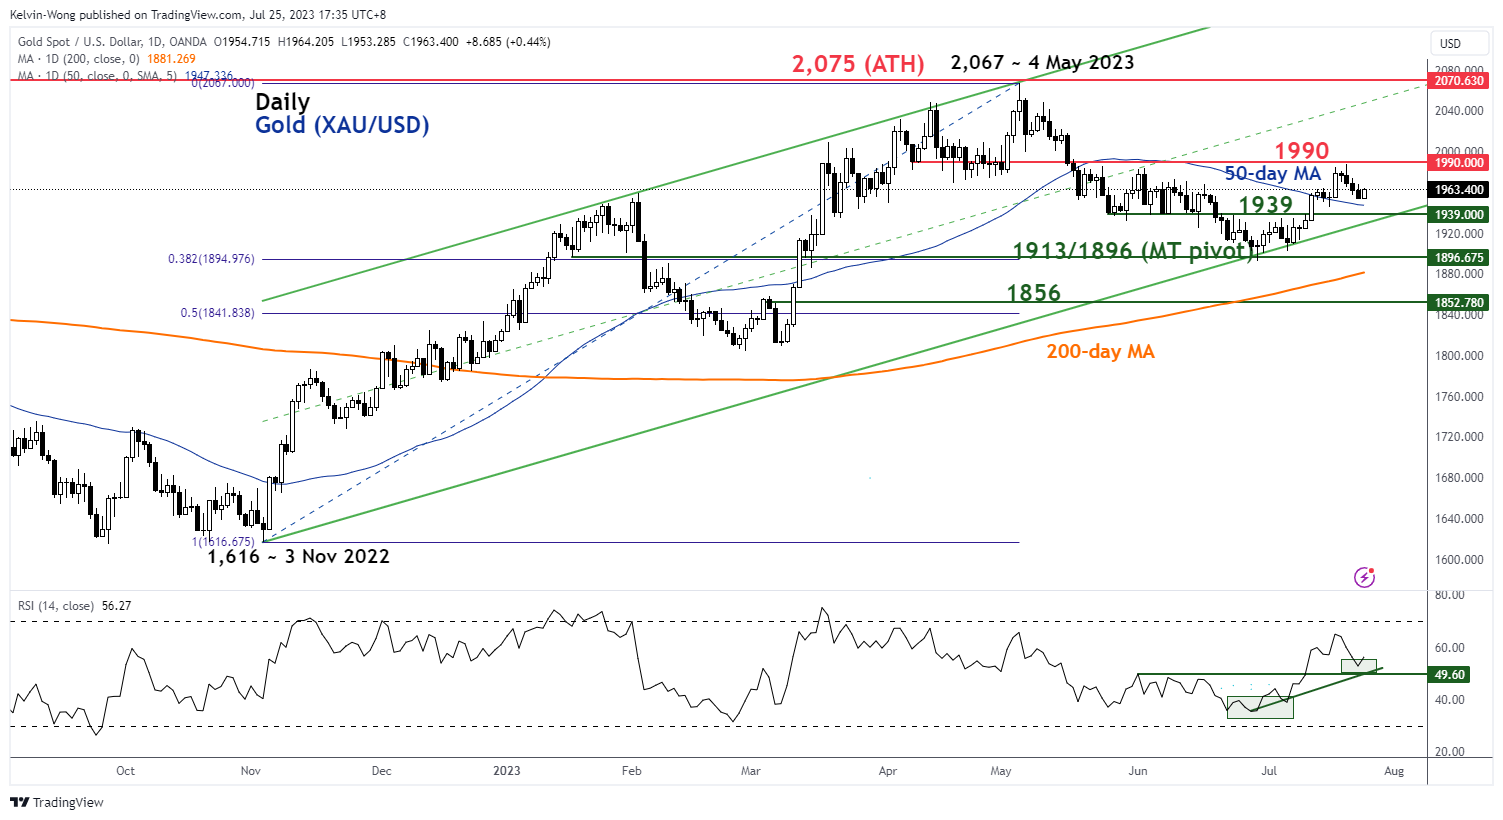
Fig 1: Gold (XAU/USD) medium-term trend of 25 Jul 2023 (Source: TradingView, click to enlarge chart)
Despite the recent slide of -1.7% from the 20 July 2023 high to print an intraday low of US$1,953.28, the medium-term uptrend phase of Gold (XAU/USD) in place since the 3 November 2022 low of US$1,616 remains intact as it price actions held right above the 50-day moving average at this time of the writing.
Short-term downside momentum has waned
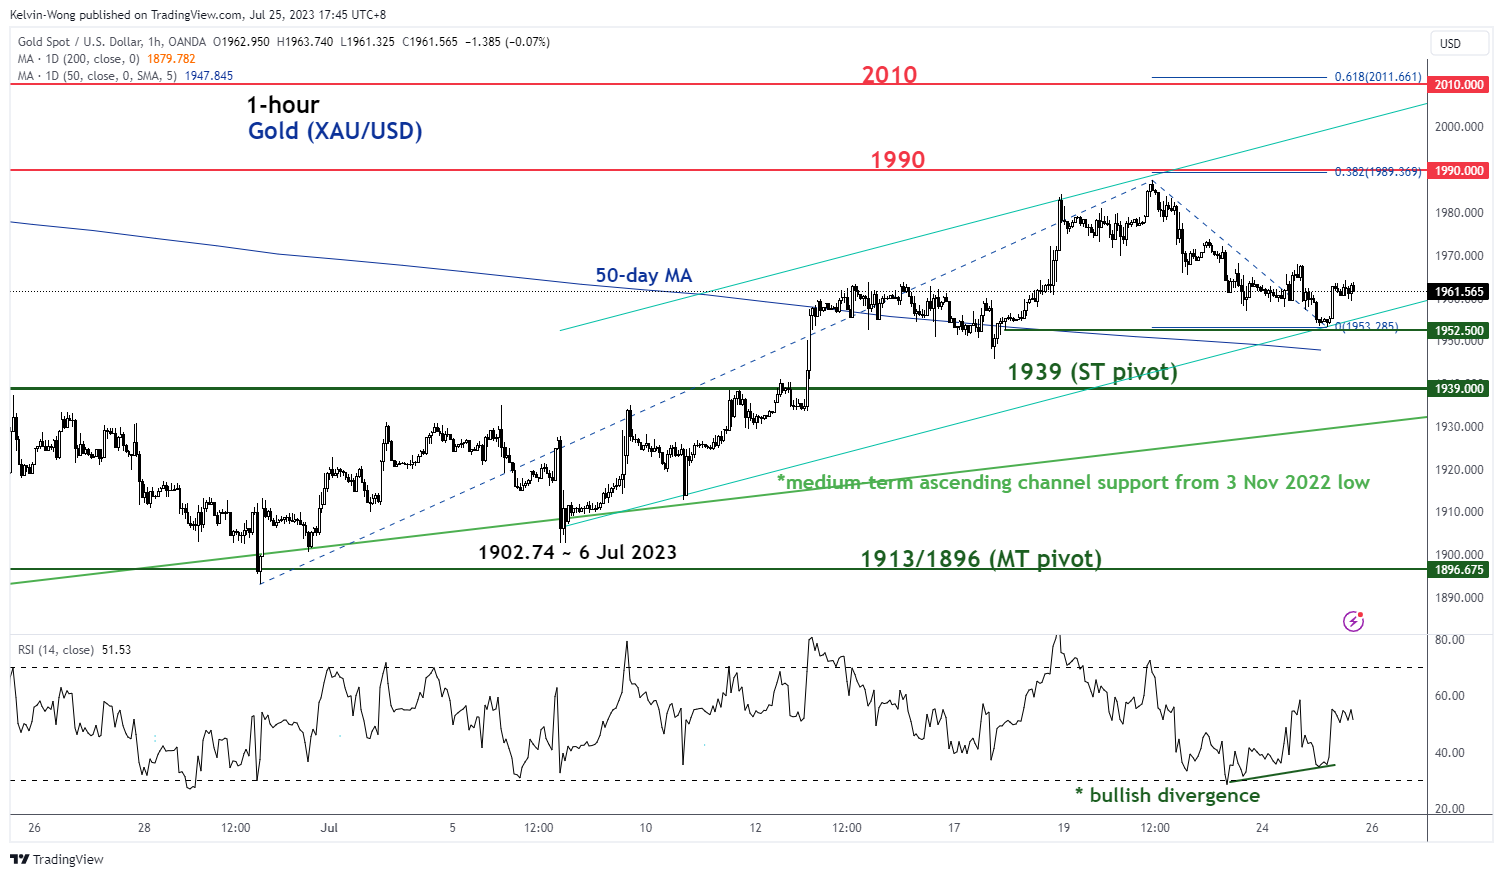
Fig 2: Gold (XAU/USD) minor short-term uptrend of 25 Jul 2023 (Source: TradingView, click to enlarge chart)
As seen on the 1-hour chart of Gold (XAU/USD), its recent slide from its 20 July 2023 high of US$ US$1,987.53 has reached the lower boundary of a minor ascending channel from 6 July 2023 low now acting as near-term support at US$1,952.50.
In addition, the hourly RSI oscillator has flashed a bullish divergence signal at its oversold region. These observations suggest that the downside momentum of the 5-day slide from the 20 July 2023 high has started to wane where a potential short-term bullish reversal may take shape.
Watch the US$1,939 key short-term pivotal support (also close to the 50-day moving average) with the intermediate resistance at US$1,990, and clearance above it sees US$2,010 next (the upper boundary of the minor ascending channel).
However, a break below US$1,939 invalidates the bullish reversal scenario to expose the medium-term support zone of US$1,913/1,896.