


- AUD is the biggest gainer (+0.22%) against the USD in today’s Asian morning session.
- The current rebound of the AUD/USD has taken shape right at the key 200-day moving now acting as support at 0.6700.
- Intermediate resistance for the AUD/USD stands at 0.6835.
Since the 20 July 2023 intraday high of 0.6847, the AUD/USD has declined by 132 pips to print a low of 0.6715 yesterday, 24 July in light of short-term bearish sentiment seen in China equities due to the continuation of bleak key economic data (Q2 GDP, retail sales, youth unemployment, housing prices) that indicates weak internal demand environment, and heightened risk of a deflationary spiral in China.
Interestingly, the 132 pips slide has managed to find support on the key 200-day moving average and staged a bounce of 41 pips to print a current intraday high of 0.6756 in today’s Asian morning session. The Aussie dollar is the strongest currency against the USD with an intraday gain of +0.22% that surpassed the other majors, GBP (+0.13%), JPY (+0.13%), NZD (+0.11%), EUR (+0.08%), CHF (+0.05%), CAD (+0.02%) at this time of the writing during today, 25 July Asian morning session.
Today’s outperformance of the AUD/USD has been reinforced by China’s top decision-making body, the Politburo which issued a statement of “hope” at the end of its meeting yesterday that vowed to implement counter-cyclical policy to boost consumption, more support for the property market, and ease local government debt.
The medium-term trend is still sideways
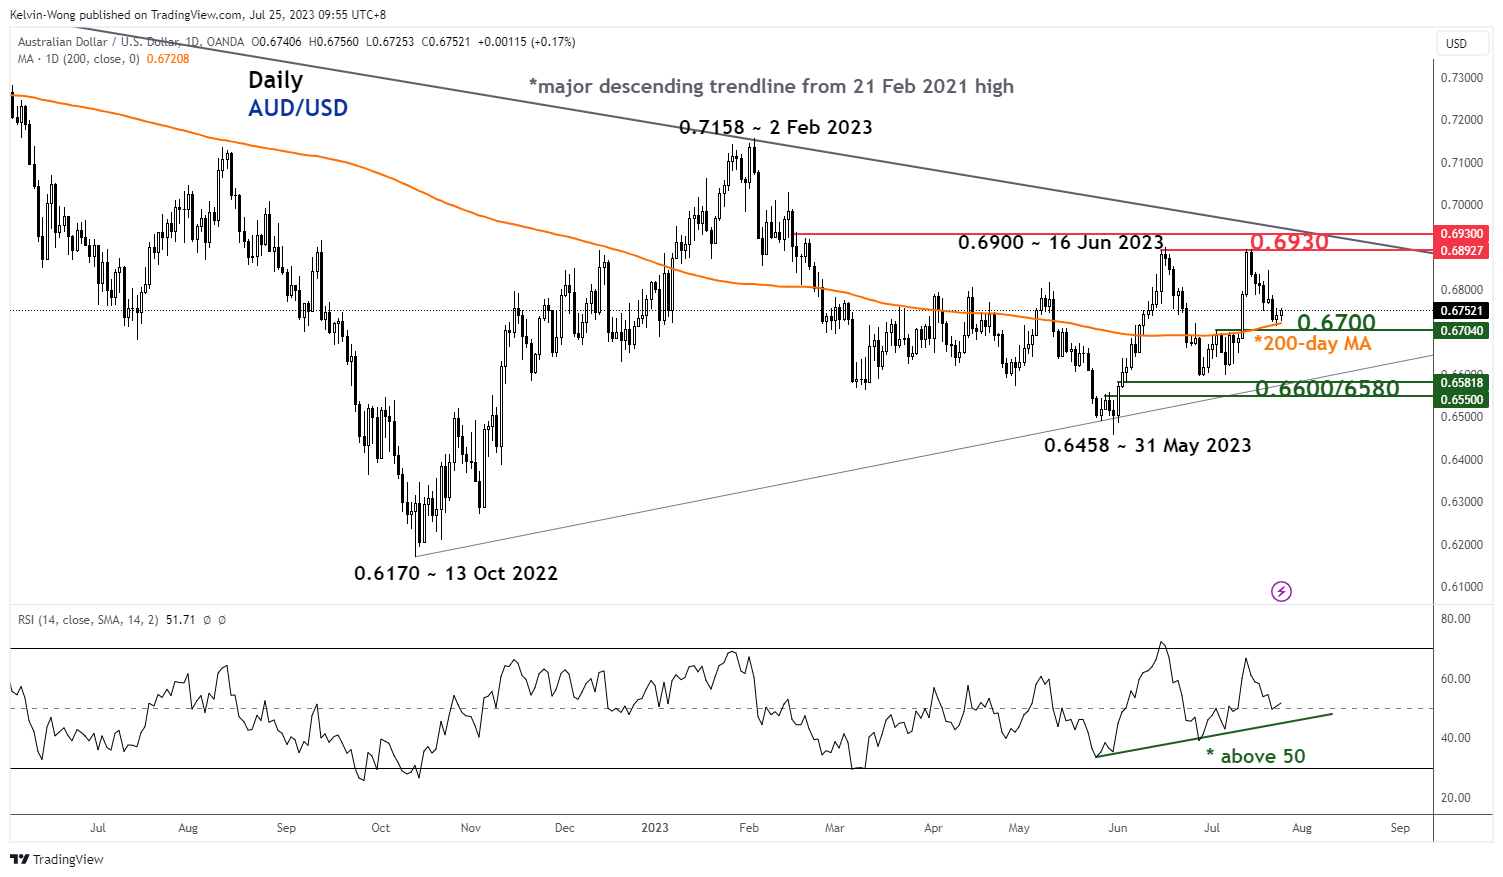
Fig 1: AUD/USD medium-term trend as of 25 Jul 2023 (Source: TradingView, click to enlarge chart)
The medium-term trend of the AUD/USD is still trapped with a sideways range configuration between 0.6930 and 0.6580.
Held at key 200-day moving average with bullish short-term momentum
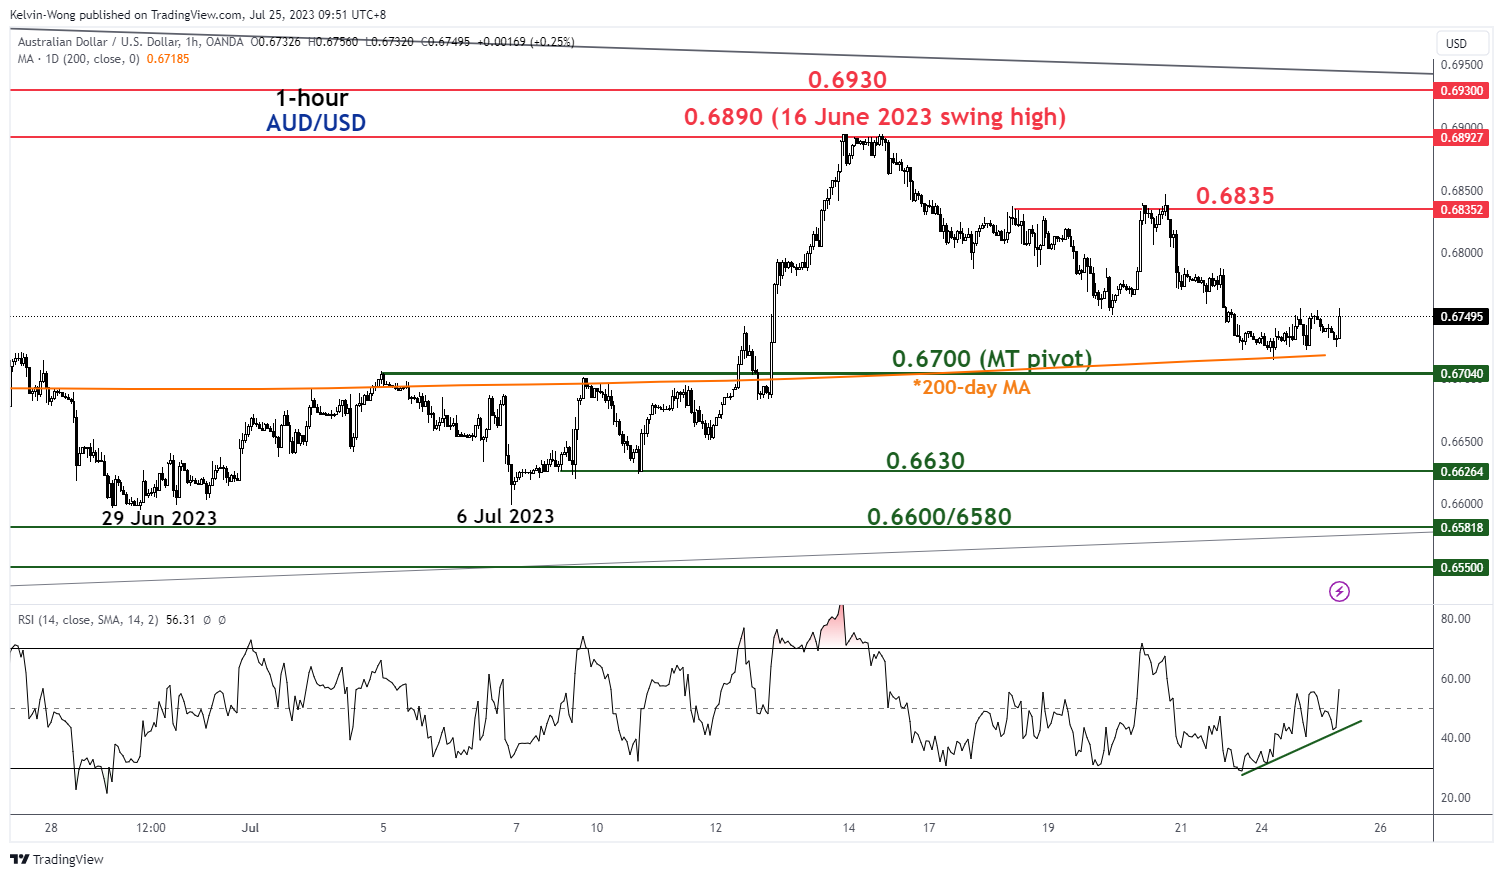
Fig 2: AUD/USD minor short-term trend as of 25 Jul 2023 (Source: TradingView, click to enlarge chart)
In conjunction with the current rebound right at the 200-day moving average, the hourly RSI oscillator has traced out a series of “higher lows” after an exit from its oversold region and has yet to reach its overbought region. These observations suggest that short-term momentum has turned bullish.
Watch the 0.6700 key medium-term pivotal support to maintain the bullish tone with intermediate resistance coming in at 0.6835 and a clearance above it sees 0.6890 next (also the 16 June 2023 swing high).
On the flip side, failure to hold above 0.6700 negates the bullish tone to expose the next near-term support at 0.6630.

 Swiss National Bank eases monetary policy and lowers SNB policy rate to 0.5%")
 25 bps Rate Cut")


 that indicates weak internal demand environment, and heightened risk of a deflationary spiral in China.)