HomeContributorsTechnical AnalysisGold Price Technical Analysis

Gold Price Technical Analysis

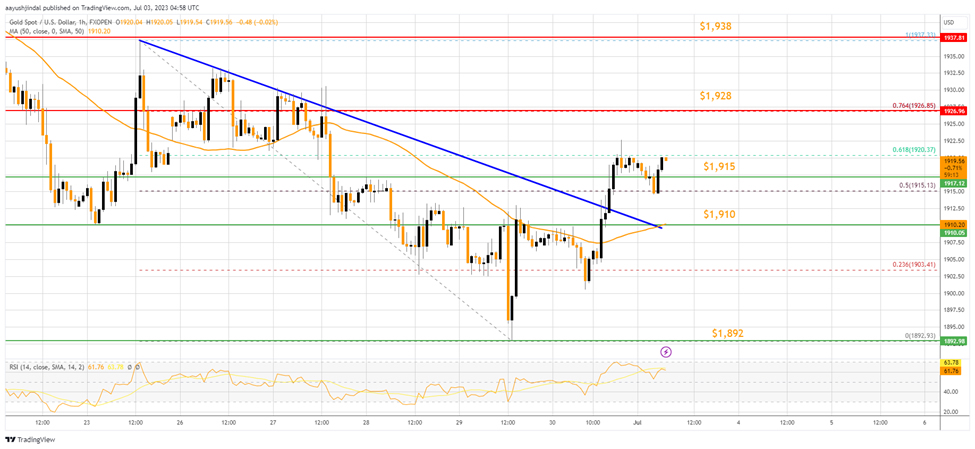
On the hourly chart of Gold on FXOpen, the price started a decent increase from the $1,892 zone against the US Dollar. The price climbed above the $1,910 resistance and the 50-hour simple moving average.

There was a move above a connecting bearish trend line at $1,912. On the upside, the price seems to be facing resistance near $1,928. The next major resistance is near the $1,938 level and the last swing high.

A clear move above the $1,938 resistance could send the price toward the $1,955 resistance. Any more gains might send the price toward $1,965.

On the downside, immediate support is near the $1,915 level. The next major support is near the $1,910 level, below which the price might drop toward the $1,892 support. Any more losses may perhaps set the tone for a test of the $1,880 zone.

FXOpen
FXOpenhttps://www.fxopen.com/
FXOpen is a global Forex and CFD Broker, founded in 2005 by a group of traders. With over 16 years of experience, the company has gained an excellent reputation a major brokerage that continues to expand rapidly. The broker offers a choice of platforms, including the popular MT4 and MT5 platforms, with a wide range of trading instruments with spreads from 0.0 pips: 600+ FX, index, share, commodity and cryptocurrency CFDs. FXOpen also provides its own PAMM technology, allowing clients to benefit from the strategies of experienced traders with a proven track record of successful trading and guarantees automatic distribution of profit and loss between the strategy provider and the strategy followers. CFDs are complex instruments and come with a high risk of losing your money. PAMM is only available in certain jurisdictions. Cryptocurrency CFDs are not available to Retail clients at FXOpen UK.

Featured Analysis

Learn Forex Trading