Currency pair EUR/USD
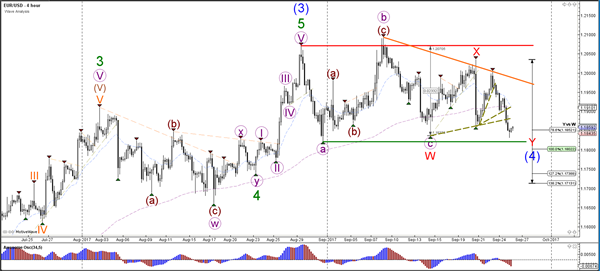
The EUR/USD closed with a bearish daily candle yesterday, which could indicate potential further bearish pressure today. However, despite the break of the support trend lines (dotted green), price is still at the bottom (green) of the sideways range and any bullish or bearish continuation will depend on how price responds at the support trend line (green).
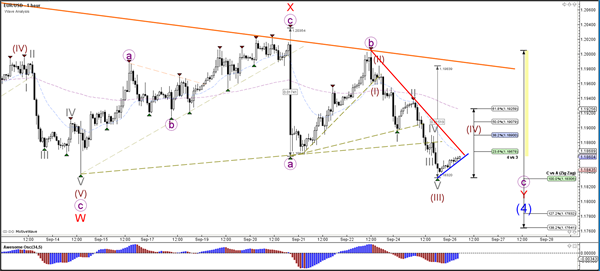
The EUR/USD could be in a wave 4 (brown) correction and the Fibonacci levels of wave 4 v 3 could act as resistance. A break above the 50% Fib of wave 4 vs 3 makes a wave 4 unlikely whereas a break below support (blue) could indicate a continuation of wave C (purple).
Currency pair GBP/USD
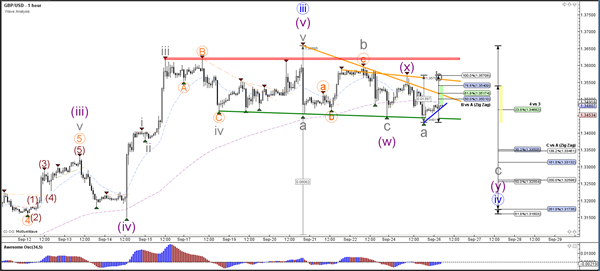
The GBP/USD is also in a sideways range (red/green lines) within a larger uptrend. Price is now testing the bottom (green) and support trend line of the correction.
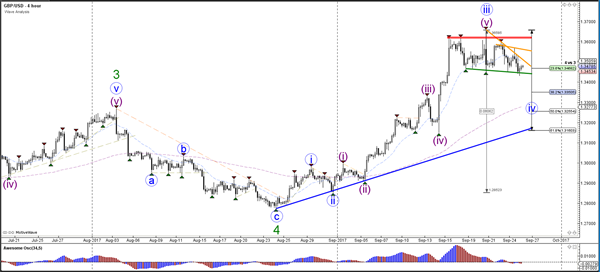
The GBP/USD has many resistance layers above it and could complete an ABC (grey) correction. A break of resistance (orange/red) could indicate the continuation of the uptrend whereas a break below support could indicate a larger wave C (grey) correction.
Currency pair USD/JPY
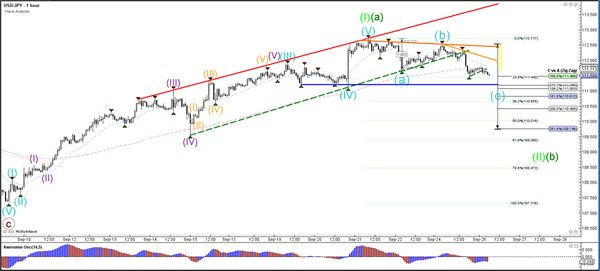
The USD/JPY has broken the support trend line (dotted green) of the uptrend channel, which could indicate a larger correction via a wave 2 (light green) or wave B (green).
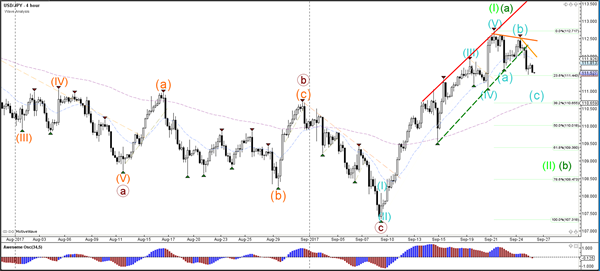
The USD/JPY is building a larger ABC (blue) correction as it breaks below various support trend lines (dotted green).
