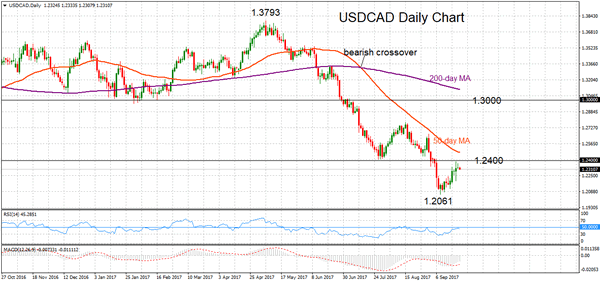
USDCAD maintains a bearish market structure on the daily chart. The pair is clearly in a downtrend and making lower peaks and lower lows since the high of 1.3793 on May 5. The market paused a corrective move from the more than 2-year low of 1.2061 and is putting in a top at 1.2390.
USDCAD will likely remain under pressure as long as it trades below key resistance at 1.2400. The recent upside momentum from the bounce off 1.2061 on September 8 has run out of steam, as indicated by the RSI oscillator which has stopped rising.
The near-term risk is to the downside, with scope for a re-test of the 1.2061 low. This level is expected to provide support but should it fail to hold, then USDCAD will resume its downtrend to target the next major low at 1.1919.
Should prices turn back up and rise above the 1.2390-1.2400 resistance zone, the downside pressure would ease and open the way for a move towards next resistance areas at the previous highs of 1.2662 and 1.2777. But only a move above 1.3000 is likely to indicate that the longer-term downtrend has ended.
The underlying bias suggests that the bearish move from May is still in progress. The negatively aligned moving averages are supporting this view, as the 50-day MA is below the 200-day MA following a bearish crossover on July 13. The near-term bias is also bearish.

