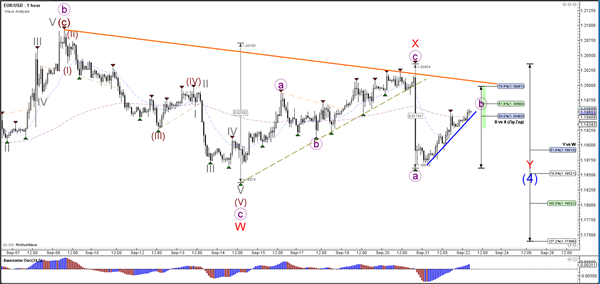
Currency pair EUR/USD
The EUR/USD is probably in an extended correction within wave 4 (blue) when considering the sideways price movement between support (green) and resistance (red). Currently I’m expecting a longer wave Y (red) because from a time perspective the current wave seems short when compared to wave X and Y (red).
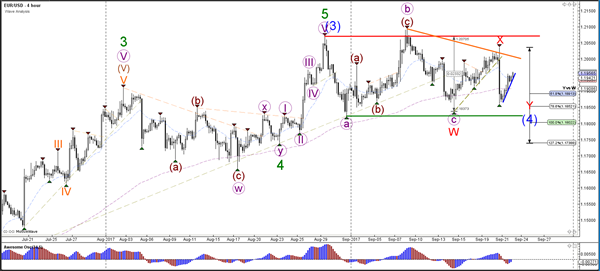
The EUR/USD could perhaps be building an ABC (purple) zigzag correction within wave Y (red). The confirmation could be a bearish candlestick pattern at the Fibonacci levels of wave B (purple) or a break of the support trend line (blue). A break above the resistance trend line (orange) and 78.6% Fib of wave B vs A with strong candles could indicate uptrend continuation.
Currency pair GBP/USD
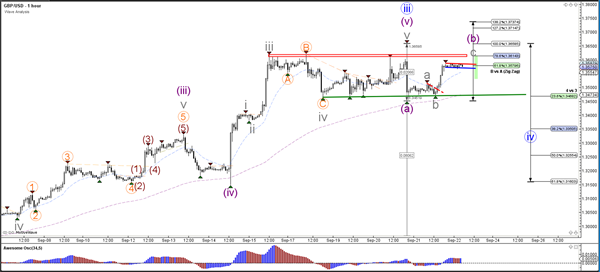
The GBP/USD bounced at the support trend line (green). The bounce could be part of the wave 4 (blue) correction as typically waves 4 are lengthy consolidation patterns.
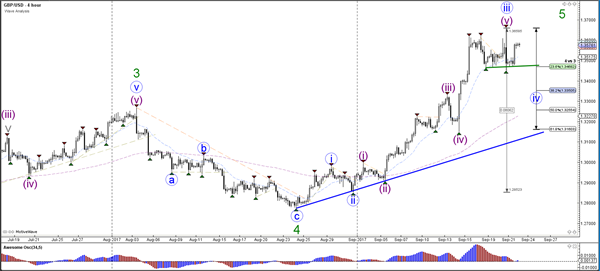
The GBP/USD is probably building an ABC (grey) correction within wave B (purple) but a break above the resistance trend lines and 78.6% Fib of wave B vs A with strong candles could indicate uptrend continuation.
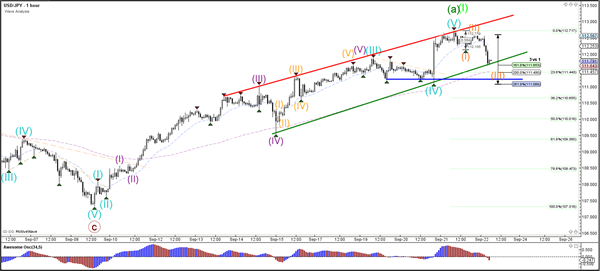
Currency pair USD/JPY
The USD/JPY did not manage to break above the resistance trend line (red) and bounced back down. Price is now testing a support trend line (green).
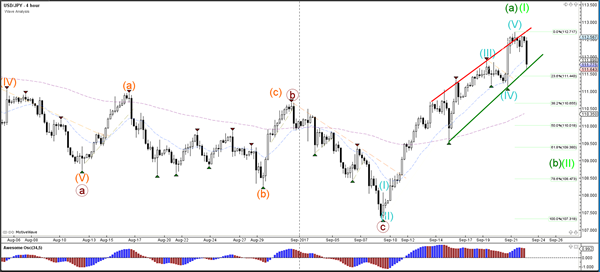
The USD/JPY could be a wave 123 (orange) which could be part of a larger ABC correction.