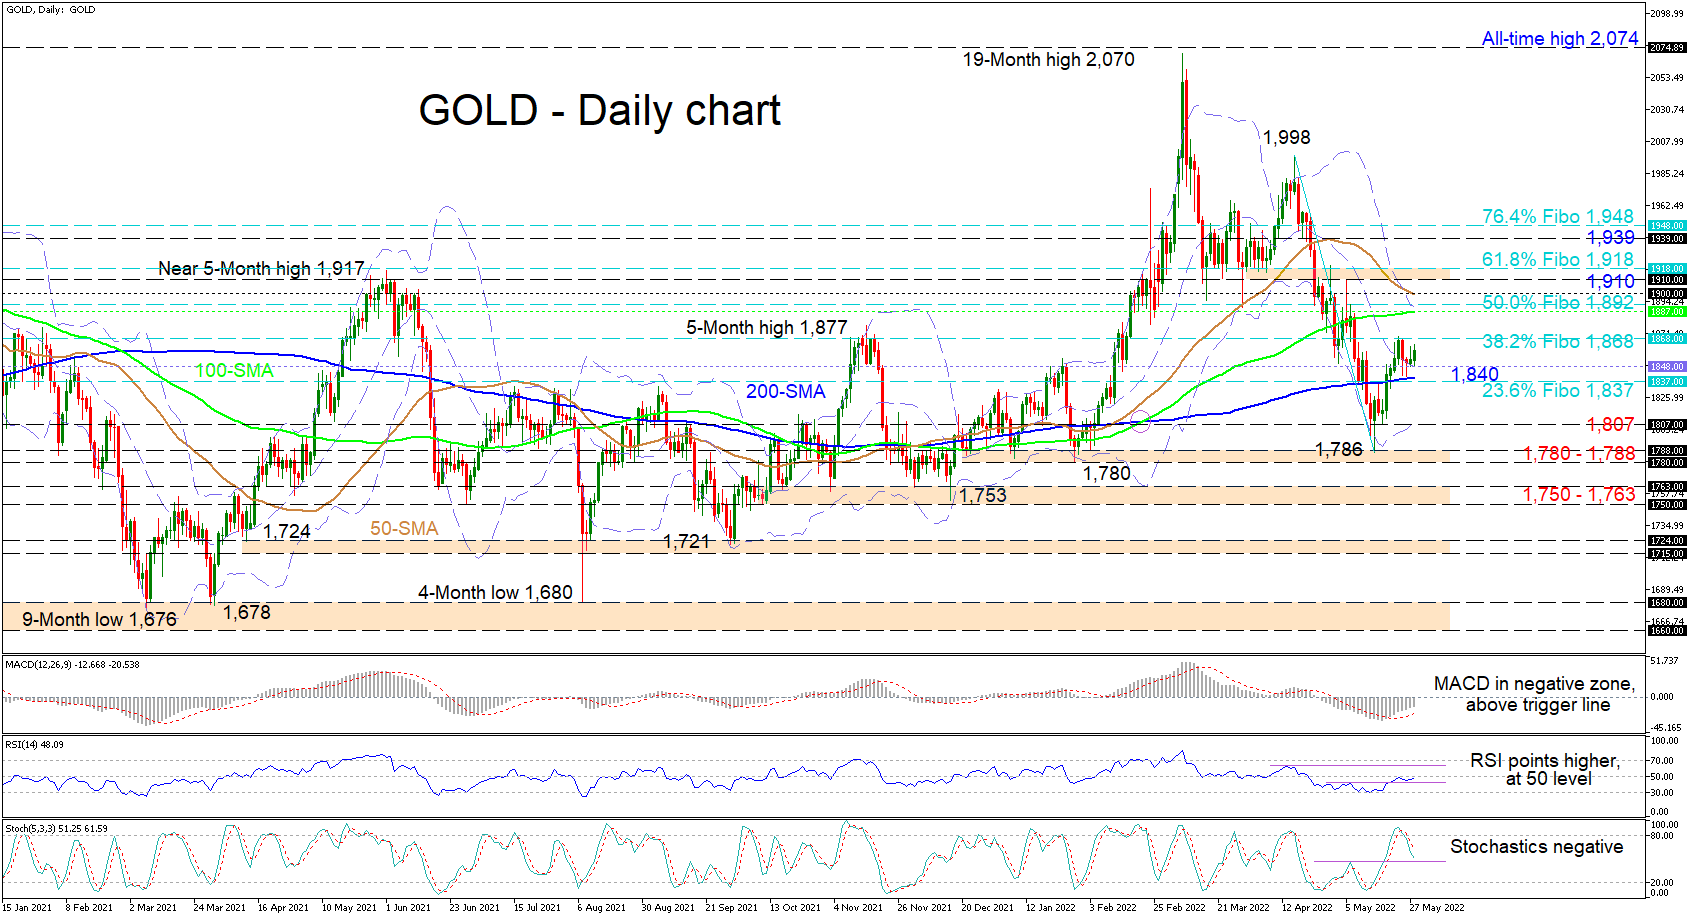
Gold is consolidating between the 1,837 and the 1,868 barriers, which are the 23.6% and the 38.2% Fibonacci retracement levels of the down leg from 1,998 until 1,786. The price is trading above its mid-Bollinger band at 1,848, after finding footing off the 200-day simple moving average (SMA) at 1,840. The SMAs are painting a picture that is lacking a clear trend, as the 100- and 200-day SMAs are sponsoring a positive bearing, while the falling 50-day SMA is aiming to complete a bearish crossover of the 100-day SMA.
The short-term oscillators are conveying mixed messages in directional momentum. The MACD, south of the zero threshold, is suggesting bullish forces are strengthening, while the RSI is indicating buyers are currently in control. Meanwhile, the negatively charged stochastic oscillator is backing additional downward price moves in the pair.
In the positive scenario, resistance could commence at the 38.2% Fibo of 1,868 that is in line with the May 24 high. Climbing further, the bulls may then encounter a fortified zone of resistance between the 100-day SMA at 1,887 and the 1,900 handle, an area that encompasses the 50-day SMA, the upper Bollinger band and the 50.0% Fibo of 1,892. In the event the price lifts beyond this boundary, a nearby resistance band linking the 1,910 high with the 61.8% Fibo of 1,918 could try to impede positive developments from tackling the 1,939 inside swing low and the nearby 76.4% Fibo of 1,948.
On the flipside, if the price recoils beneath the mid-Bollinger band at 1,848, coupled support could transpire from the 200-day SMA and the 23.6% Fibo at 1,837. Dipping lower, the bears may then eye the 1,807 obstacle, where the lower Bollinger band also resides, prior to targeting the 1,780-1,788 support base that extends back to the second half of December 2021. Breaching this key foundation, the 1,750-1,763 support border could then come under strong fire from sellers.
Summarizing, Gold is exhibiting a neutral demeanour, trading within the 23.6% and the 38.2% Fibonacci retracement levels. For the precious metal to revive a clearer direction, the price would need to break either below the 23.6% Fibo at 1,837 or above the 38.2% Fibo at 1,868. A drop in the price underneath the 1,780-1,788 boundary could reinforce negative tendencies, but a climb north of the 1,900 hurdle is required to boost buyers’ confidence.