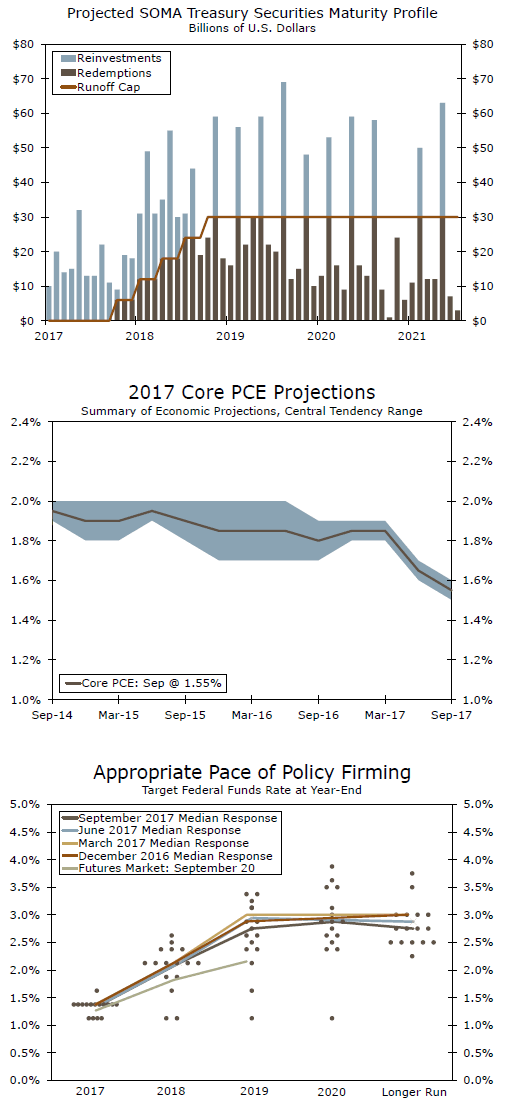
With the current FOMC assessment, we are back to a position in the economy where the FOMC can begin to normalize its balance sheet. The key story is the implied rise into positive real rates ahead.
Focus on the Balance Sheet As Planned
FOMC officials are comfortable enough with the strength and sustainability of the U.S. economy to finally initiate a draw-down of the balance sheet to levels more consistent with normal economic conditions. As such, the balance sheet run-off will commence (starting in October) with modest caps of $10 billion per month ($6 billion for Treasuries and $4 billion for agency/MBS), reinvesting principal payments that exceed those caps. Every three months, and assuming economic conditions still warrant the terms, the Fed will raise those caps by equal amounts four more times, until the final cap amount stands at $50 billion per month ($30 billion for Treasuries and $20 billion for agency/MBS). Nearly one-half of the Fed’s $2.4 trillion in Treasury holdings come due between now and 2020, making now an opportune time for the Fed to begin to reduce the size of its balance sheet (top graph). This pattern does not represent an issue until late 2018 when caps start to exceed reinvestment flows.
Economic Projections as a Basis for Policy: Lower Inflation
According to the FOMC, the U.S. economy entered the current quarter with renewed strength (Q2 U.S. GDP at a 3.0 percent annualized pace). Likewise, the hurricanes’ shock is temporary and, therefore, does not appear set to derail the underlying strength of the U.S. economy.
As for inflation (middle graph), the FOMC lowered its median expectation for both overall and PCE inflation a touch for 2018 and then held steady the pace of inflation for 2019 and 2020 at the 2 percent target.
We differ. There is a clear structural break in inflation (both CPI and the PCE deflator) after 2008. Moreover, the recent weakness in inflation is not solely transitory (please refer to our recent report: Inflation Slowdown: Transitory or Persistent). Finally, there is a persistent pattern in inflation that helps explain why it has taken so long for the inflation pace get back to 2 percent. Our core PCE inflation forecast is lower than the FOMC’s for 2018 to reflect the long drawn out pattern of inflation adjustments.
Dot Plot, Real Interest Rates and Fixed Income Implications
An updated FOMC policy statement and the economic projections indicate a steady rise in the funds rate (dot-plot in bottom graph) and, given the steady FOMC projections for inflation, the net result is a steady rise in the real short-term fed funds rate. This rise in real rates will represent a significant shift given that the majority of this economic and financial recovery has occurred in an environment of negative real rates.
The updated dots for 2017 do not take a December rate hike off the table. However, the dots do imply there is one less FOMC move in 2019. Interesting to note that the fed funds rate for 2020 at 2.9 percent is actually higher than the long-run 2.8 percent.

