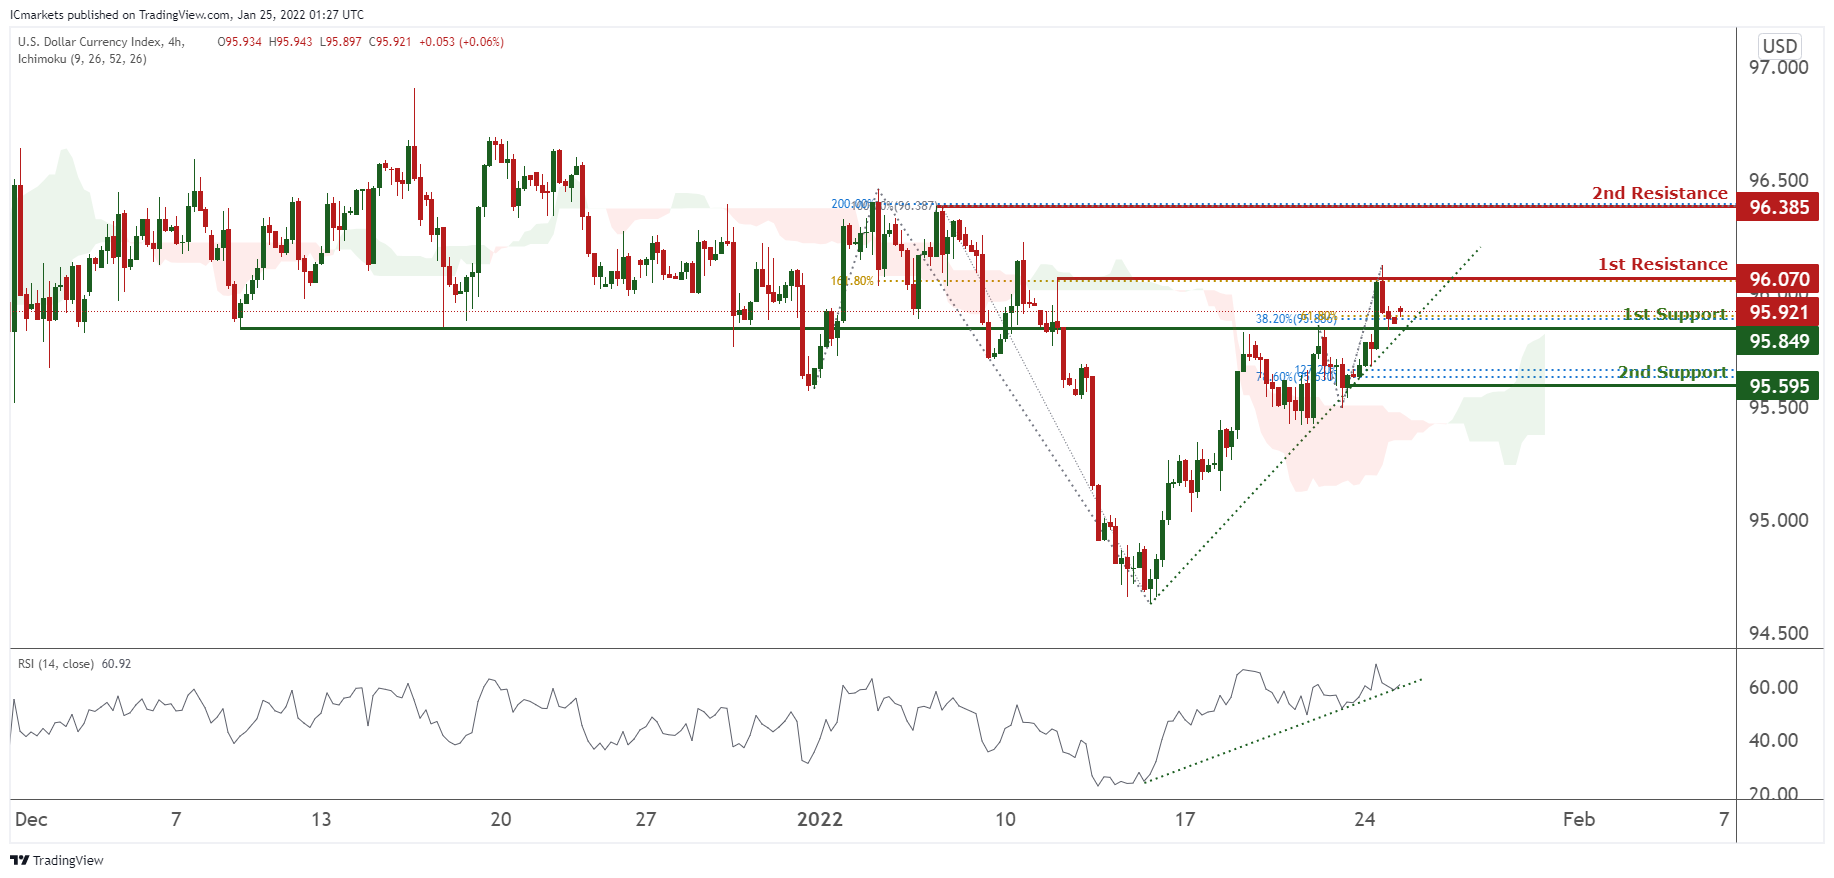
DXY:
On the H4 timeframe, prices are on bullish momentum and abiding to our ascending trendline. We would expect potentially a bounce from our 1st support at 95.921 in line with 38.2% Fibonacci retracement and 61.8% Fibonacci extension towards our 1st resistance at 96.070 in line with 161.8% Fibonacci projection. RSI is showing bullish momentum and prices are trading above our Ichimoku clouds, further supporting our bullish bias.
Areas of consideration:
- H4 time frame, 1st resistance at 96.070
- H4 time frame, 1st support at 95.849
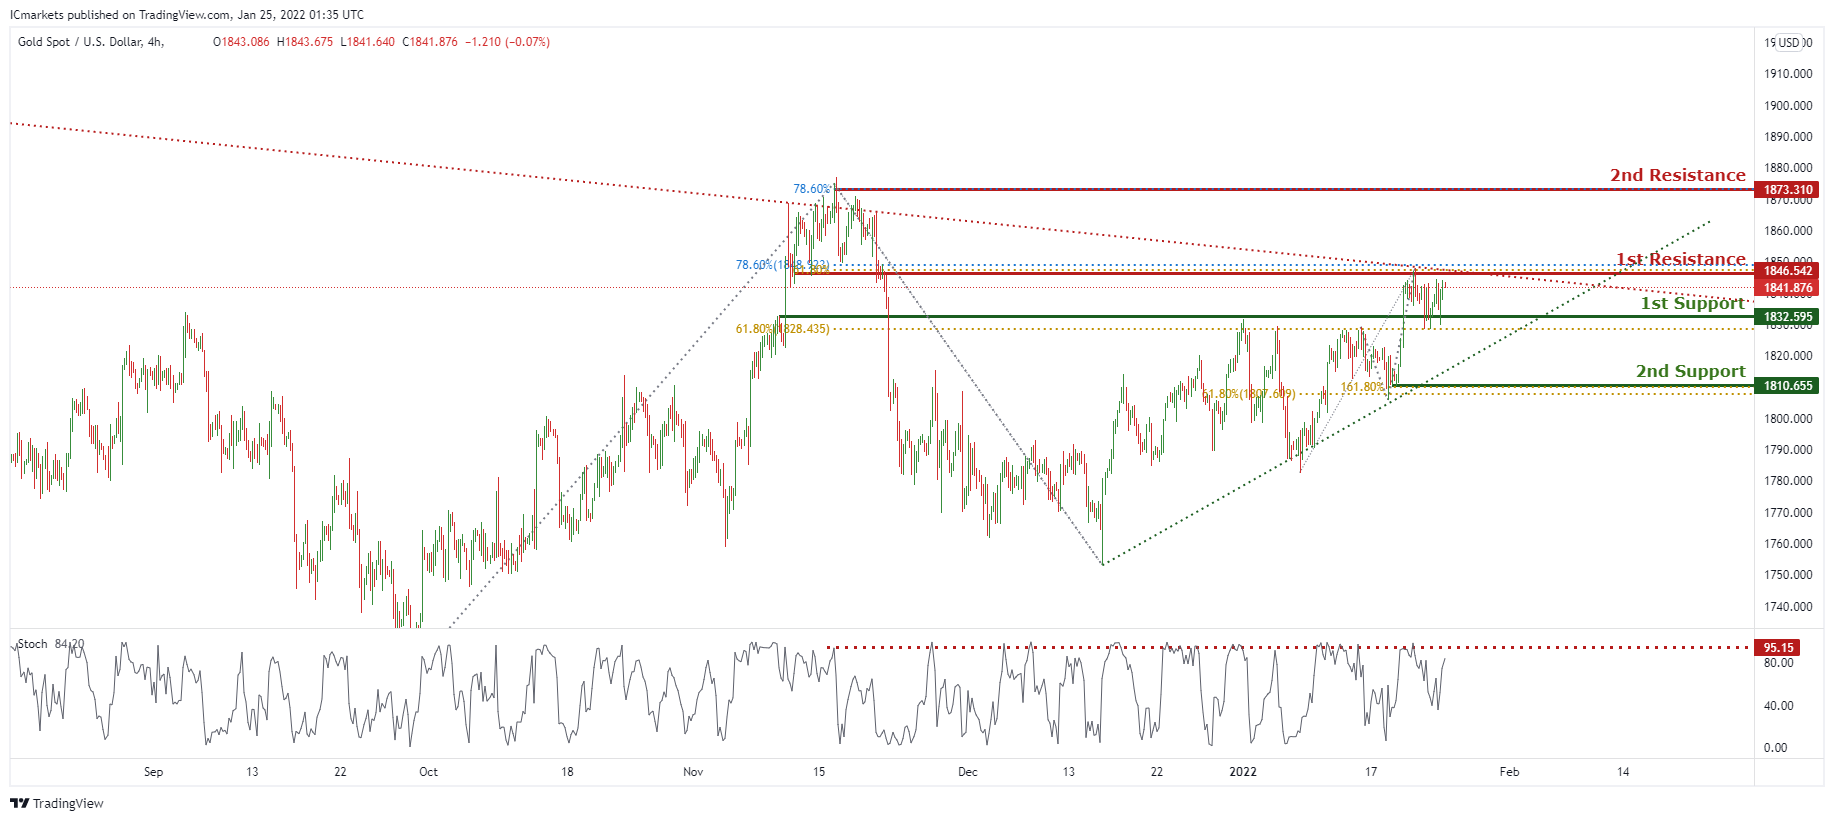
XAU/USD (GOLD):
On the H4 chart, prices are on bullish momentum and consolidating in a triangle pattern. We see a potential for a dip from our 1st resistance at 1846.542 in line with 78.6% Fibonacci extensions and 61.8% Fibonacci retracement towards our 1st support at 1832.595 in line with 61.8% Fibonacci retracement. Stochastics are close to a level where dips previously occurred.
Areas of consideration:
- 4h 1st support at 1832.595
- 4h 1st resistance at 1846.542
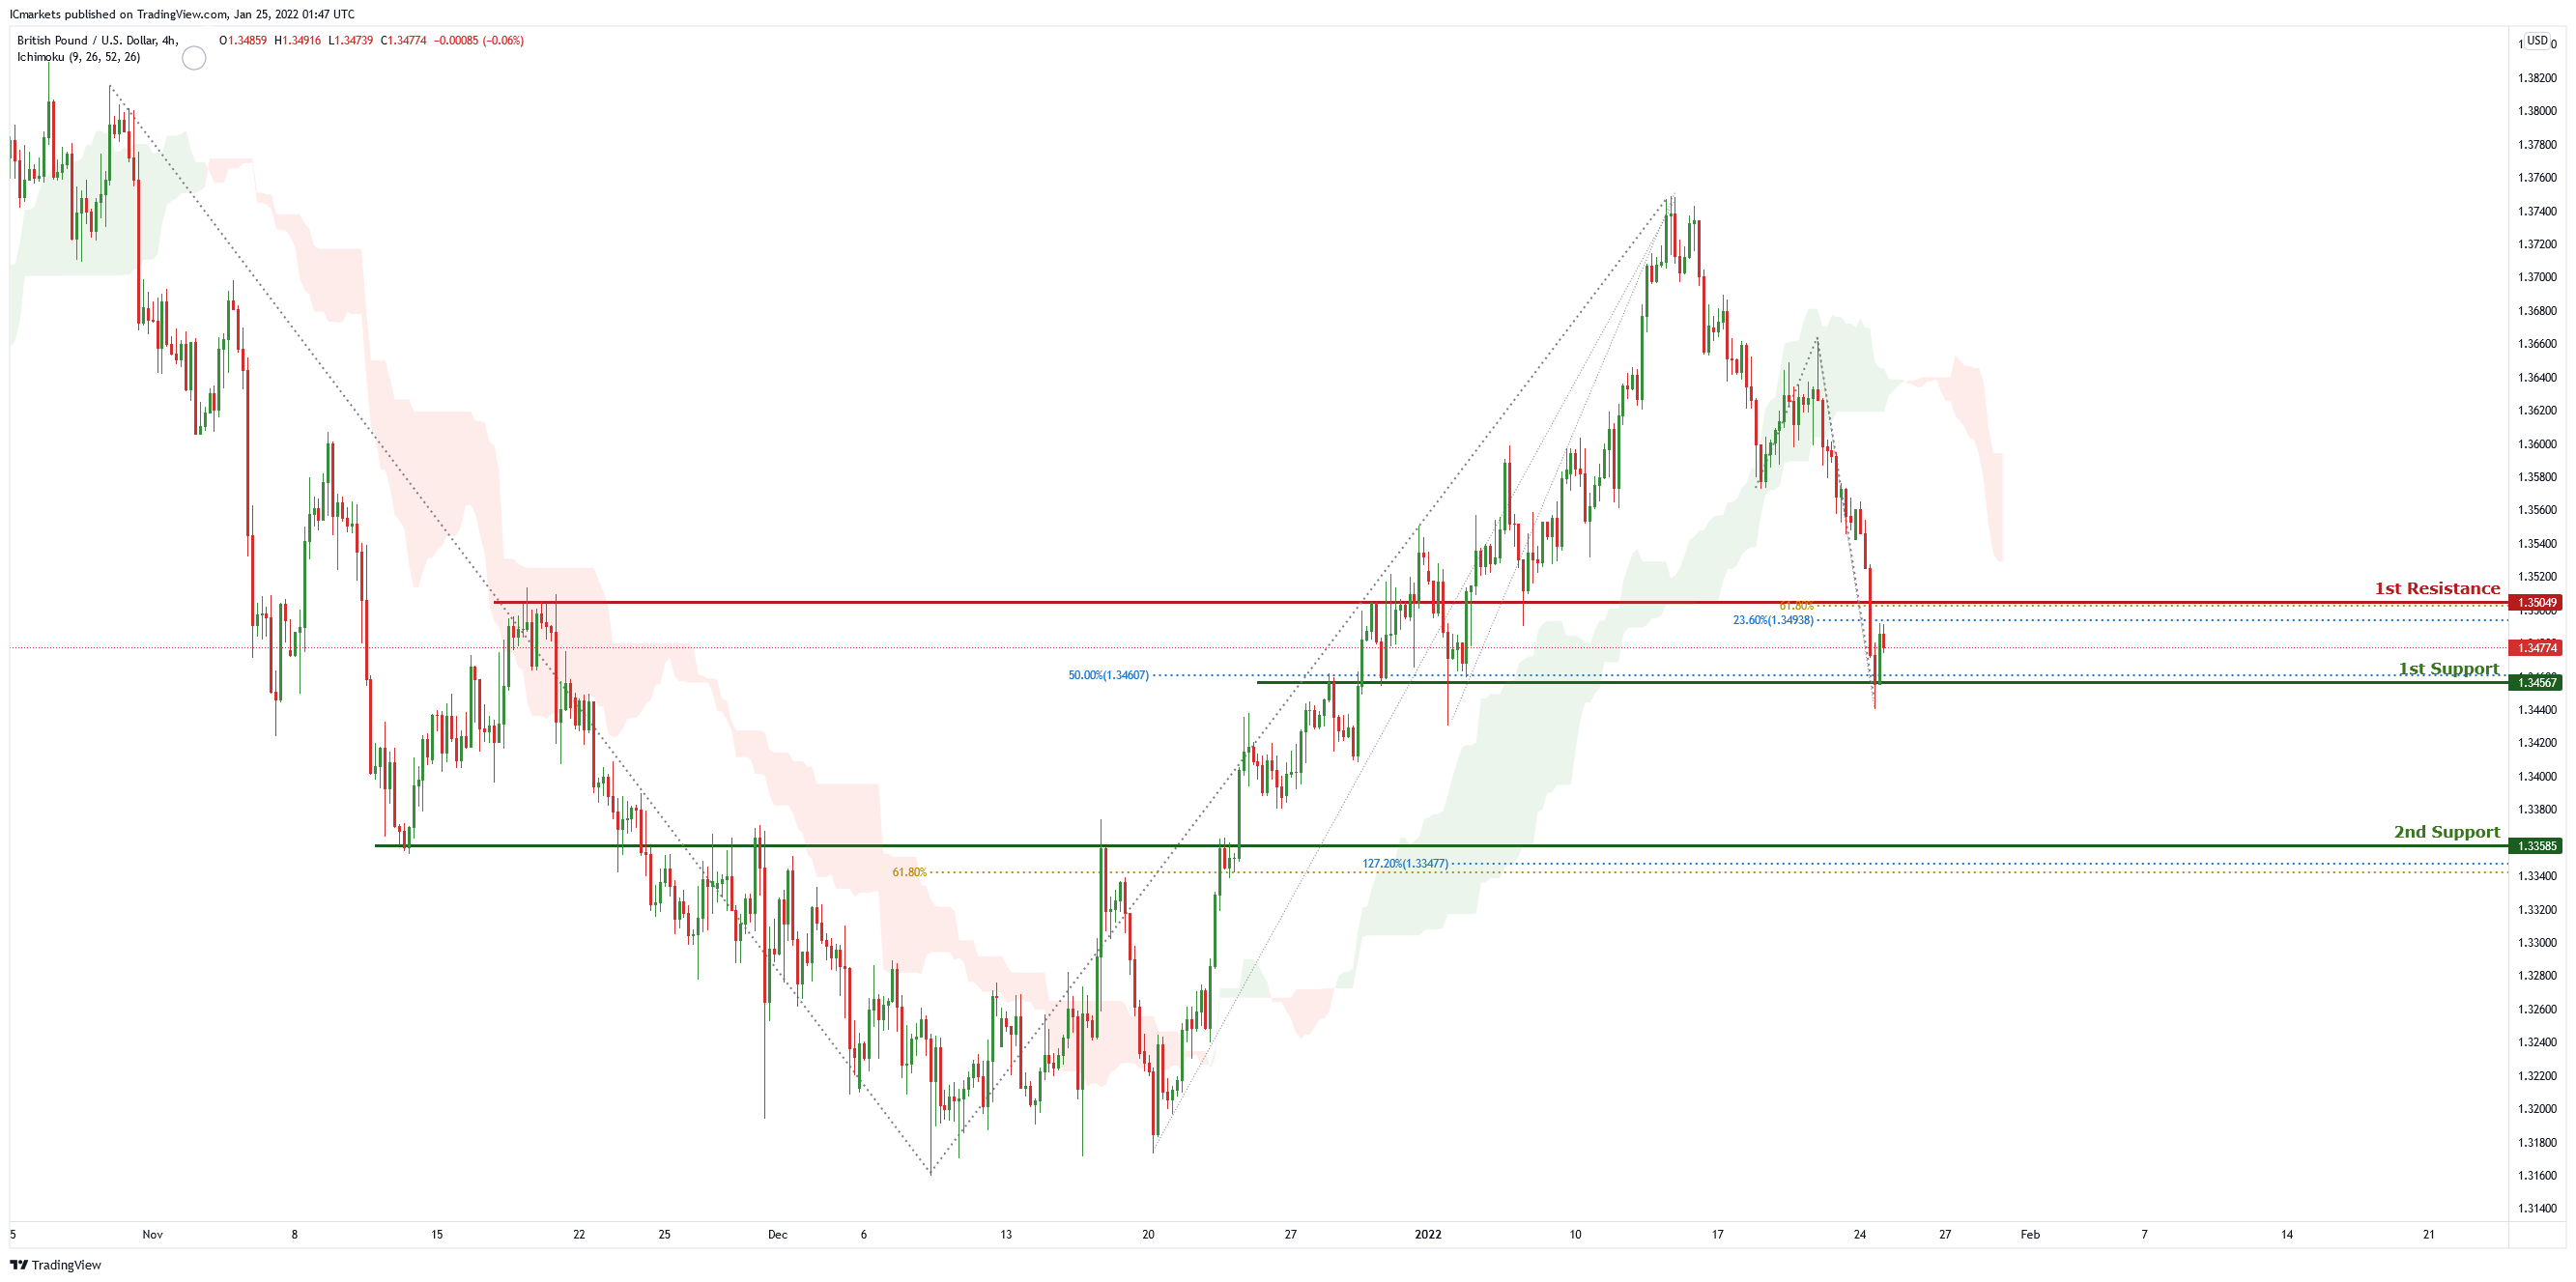
GBP/USD
On the H4 chart price is near 1st support level of 1.34567 which is also 50% Fibonacci retracement. Price can potentially dip to the 2nd support level of 1.33585 which is also 127.2% Fibonacci retracement and 61.8% Fibonacci projection. Our bearish bias is supported by the ichimoku cloud indicator as price is trading below it.
Areas of consideration
- H4 1st support 1.34567
- H4 2nd support 1.33585
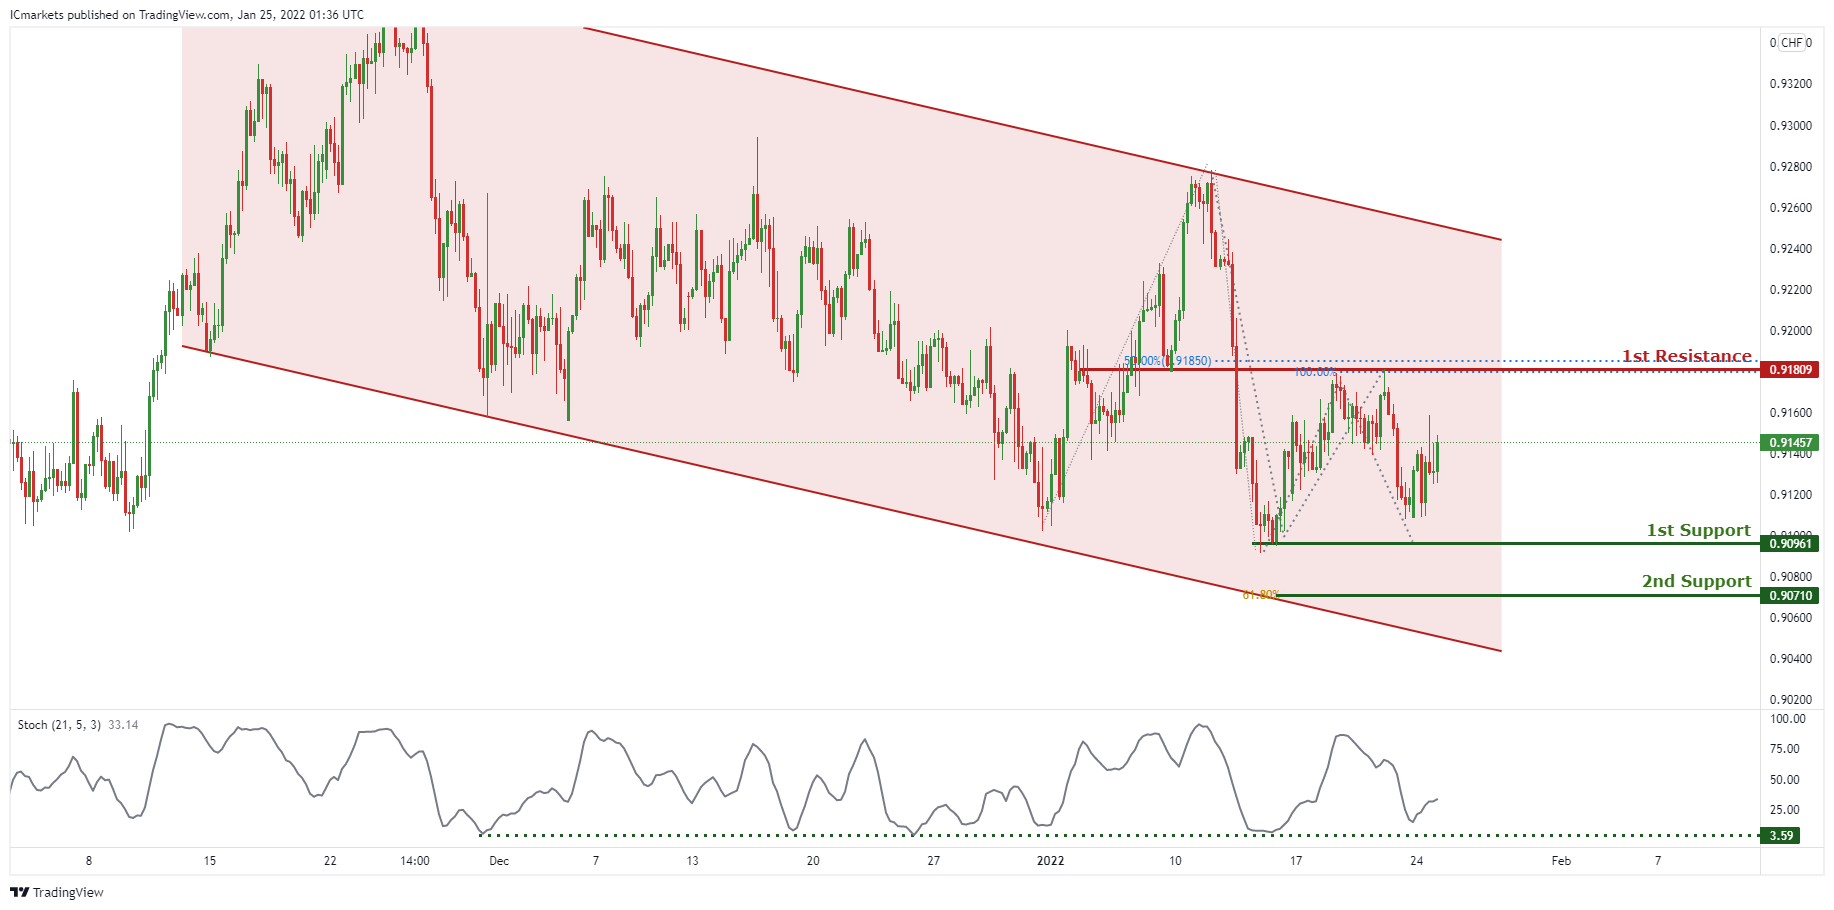
USD/CHF:
In reference to last week’s analysis, price indeed dropped from 1st Resistance and approaching 1st Support @ 0.90961. On the H4 timeframe, price is abiding to a descending channel, signifying a bearish momentum. However, we can expect price to make a short-term bullish bounce from 1st Support in line with previous swing low towards 1st Resistance in line with 100% Fibonacci projection and 50% Fibonacci retracement. Our short-term bullish bias is further supported by stochastic indicator where the %K line is approaching the support level. Traders can wait for prices to swing higher or lower before entering.
Areas of consideration:
- Watch 1st Support at 0.90961
- Watch 1st Resistance at 0.91809
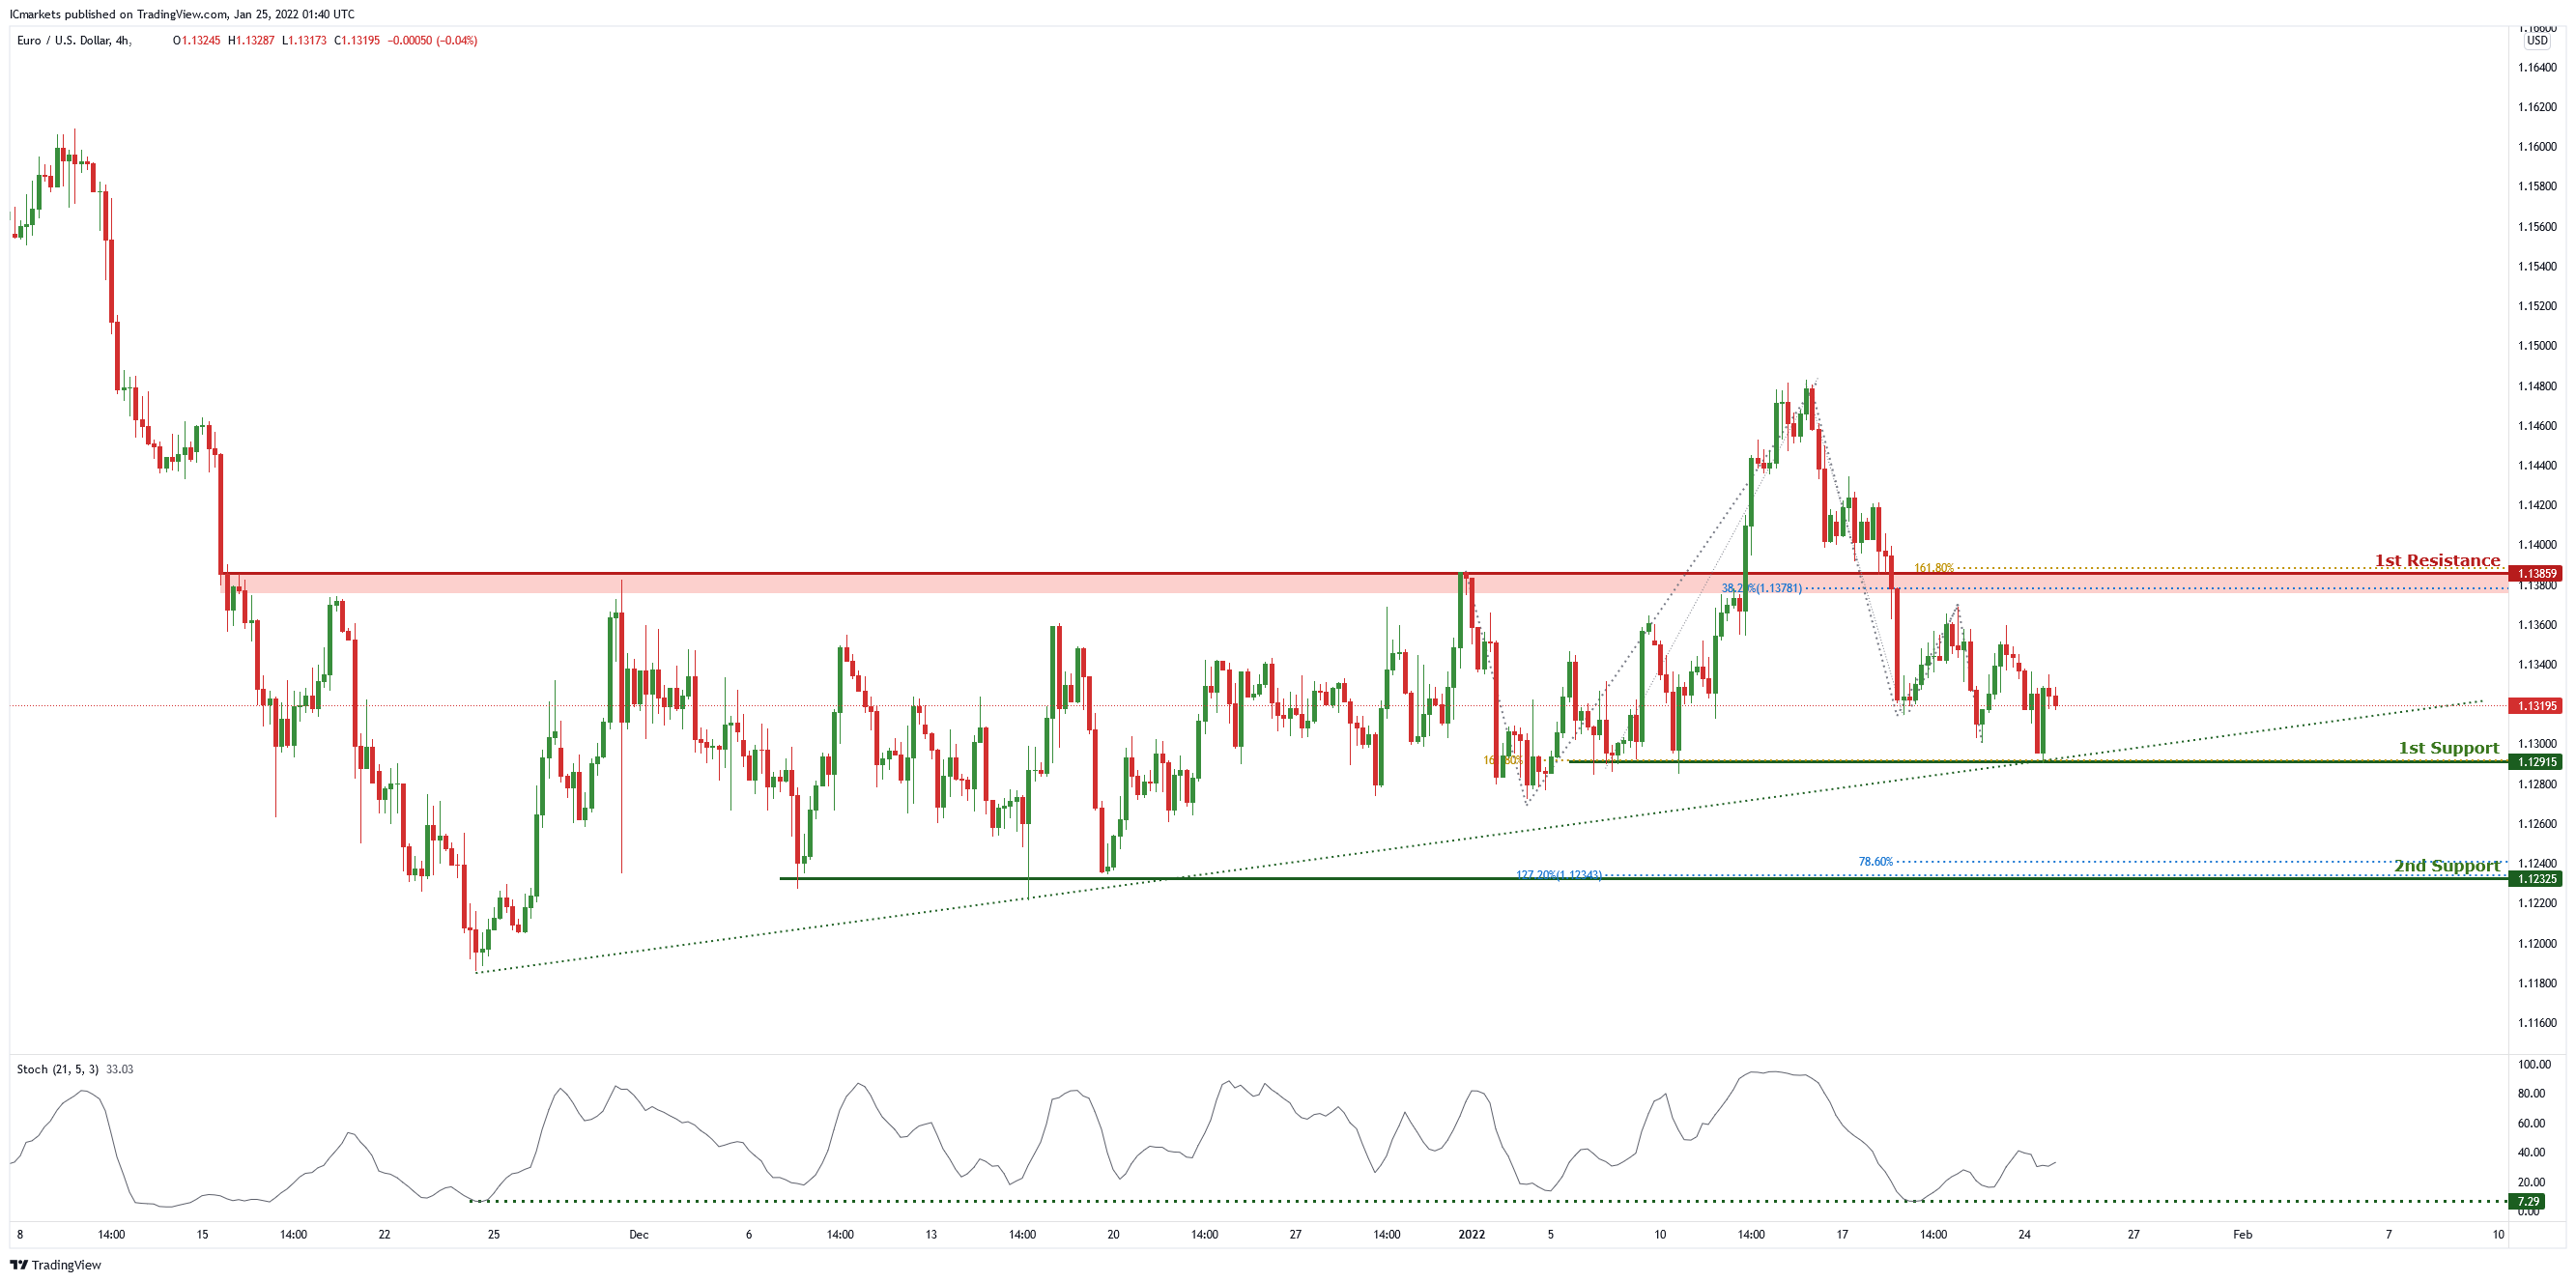
EUR/USD :
On the H4 chart , price is abiding by the ascending trendline and is in the middle of the 1st resistance of 1.13859 which is also 38.2% Fibonacci retracement, 61.8% Fibonacci projection and 1st support level of 1.12915 which is also 161.8% Fibonacci projection. Price can potentially go to the 1st resistance level. Our bullish bias is supported by the stochastic indicator as it is near support level.
Areas of consideration
- 1st resistance at 1.13859
- 1st support at 1.12915
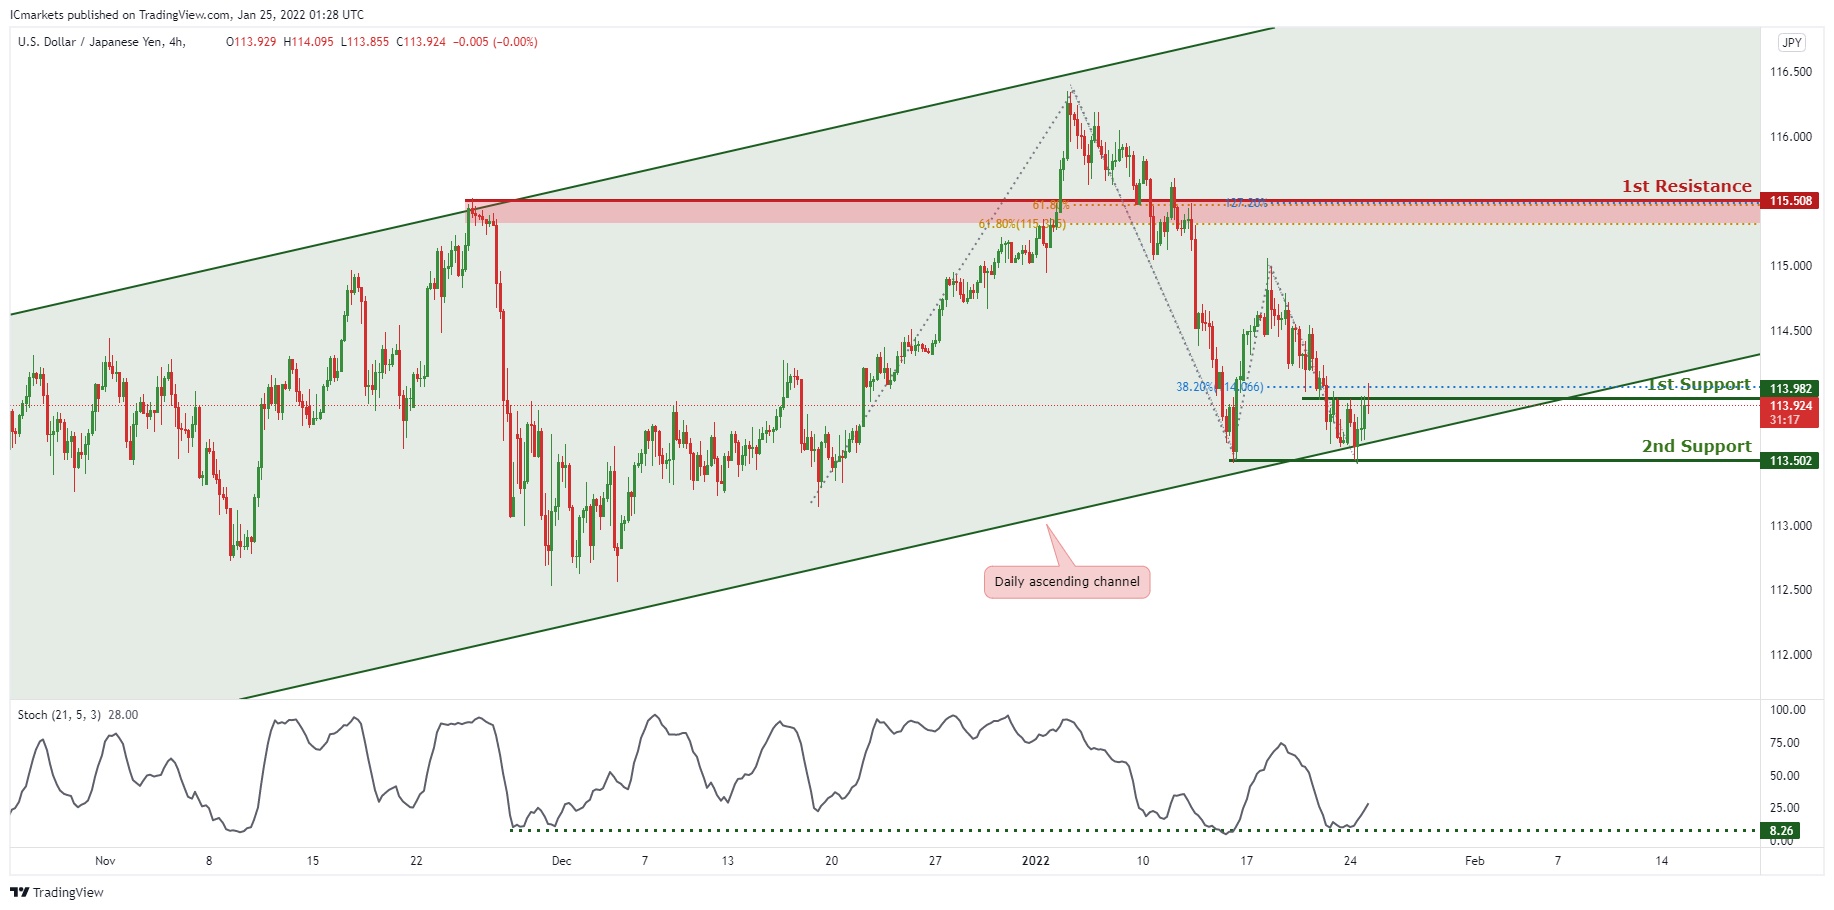
USD/JPY:
On the H4 timeframe, is abiding to the ascending channel on the daily, signifying an overall bullish momentum. We can now expect the price to bounce from 1st Support in line with 38.2% Fibonacci retracement towards 1st Resistance in line with 61.8% Fibonacci projection and 61.8% Fibonacci retracement. Our bullish bias is further supported by the stochastic indicator where the %K line is at the support level.
Areas of consideration:
- H4 1st resistance level 115.508
- H4 1st support level 113.982
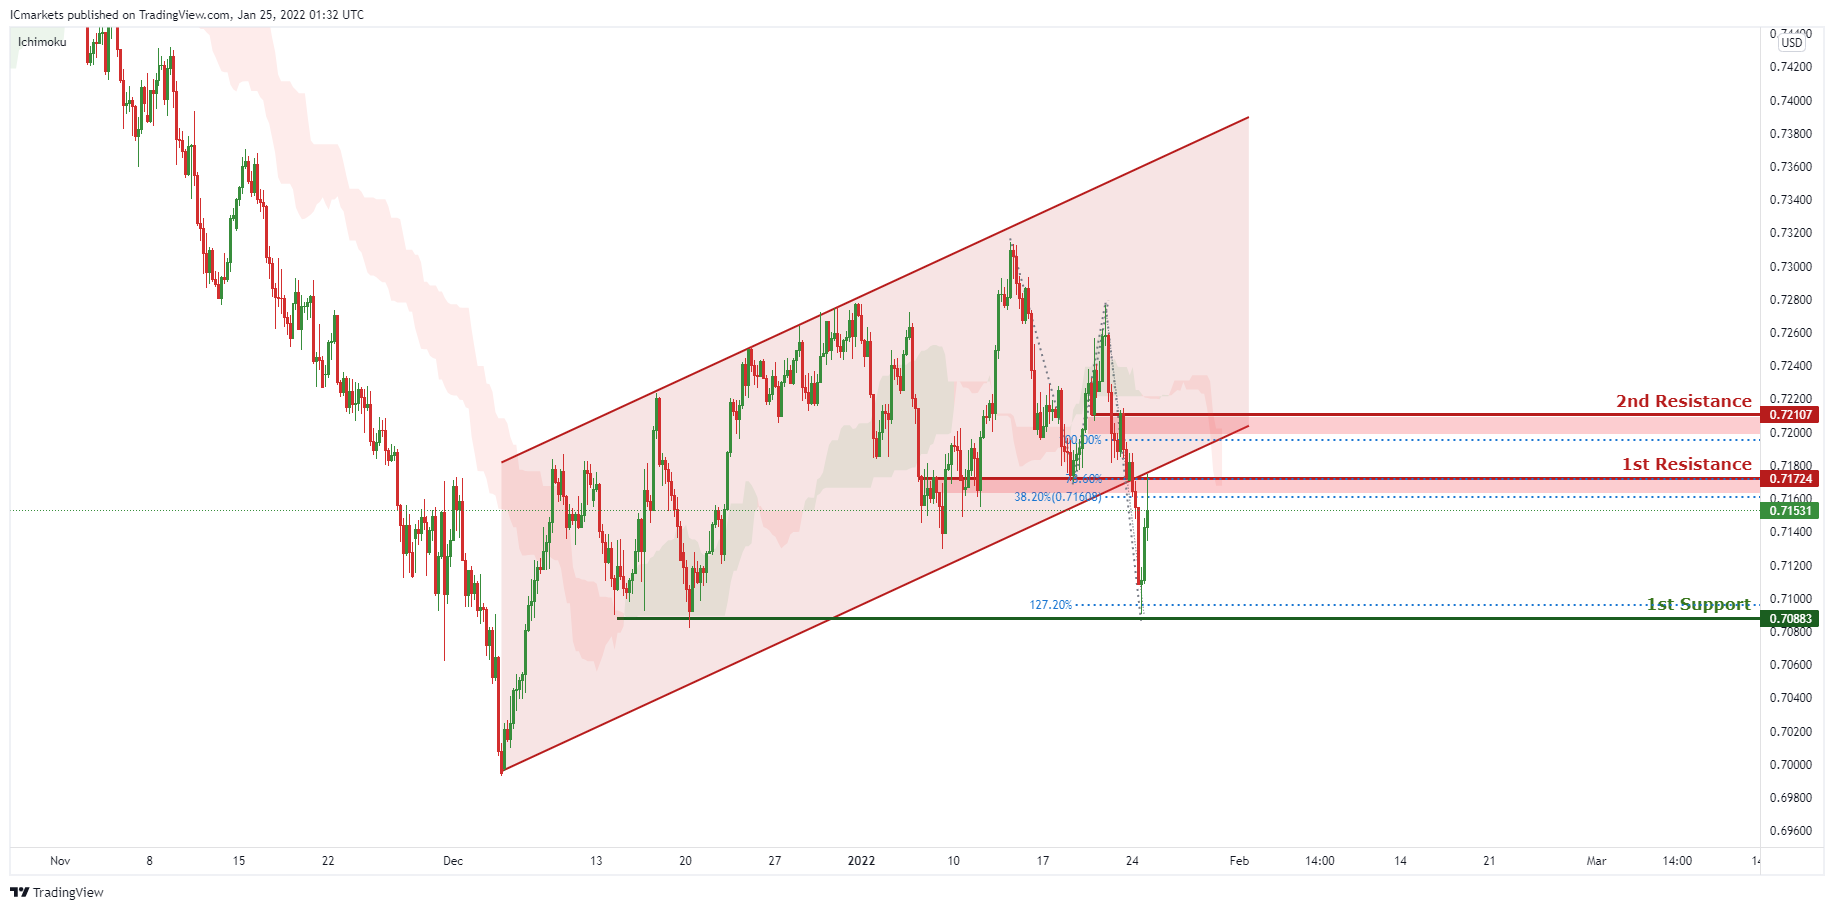
AUD/USD:
On the H4, price broke out of the ascending channel, signifying an overall bearish momentum. We can expect price to drop from 1st Resistance in line with 78.6% Fibonacci projection and 38.2% Fibonacci retracement towards 1st Support in line with graphical support level and 127.2% Fibonacci projection. Our bearish bias is further supported by the Ichimoku cloud indicator where the price is holding below it.
Areas of consideration:
- H4 1st Support level 0.70883
- H4 1st resistance level 0.71724
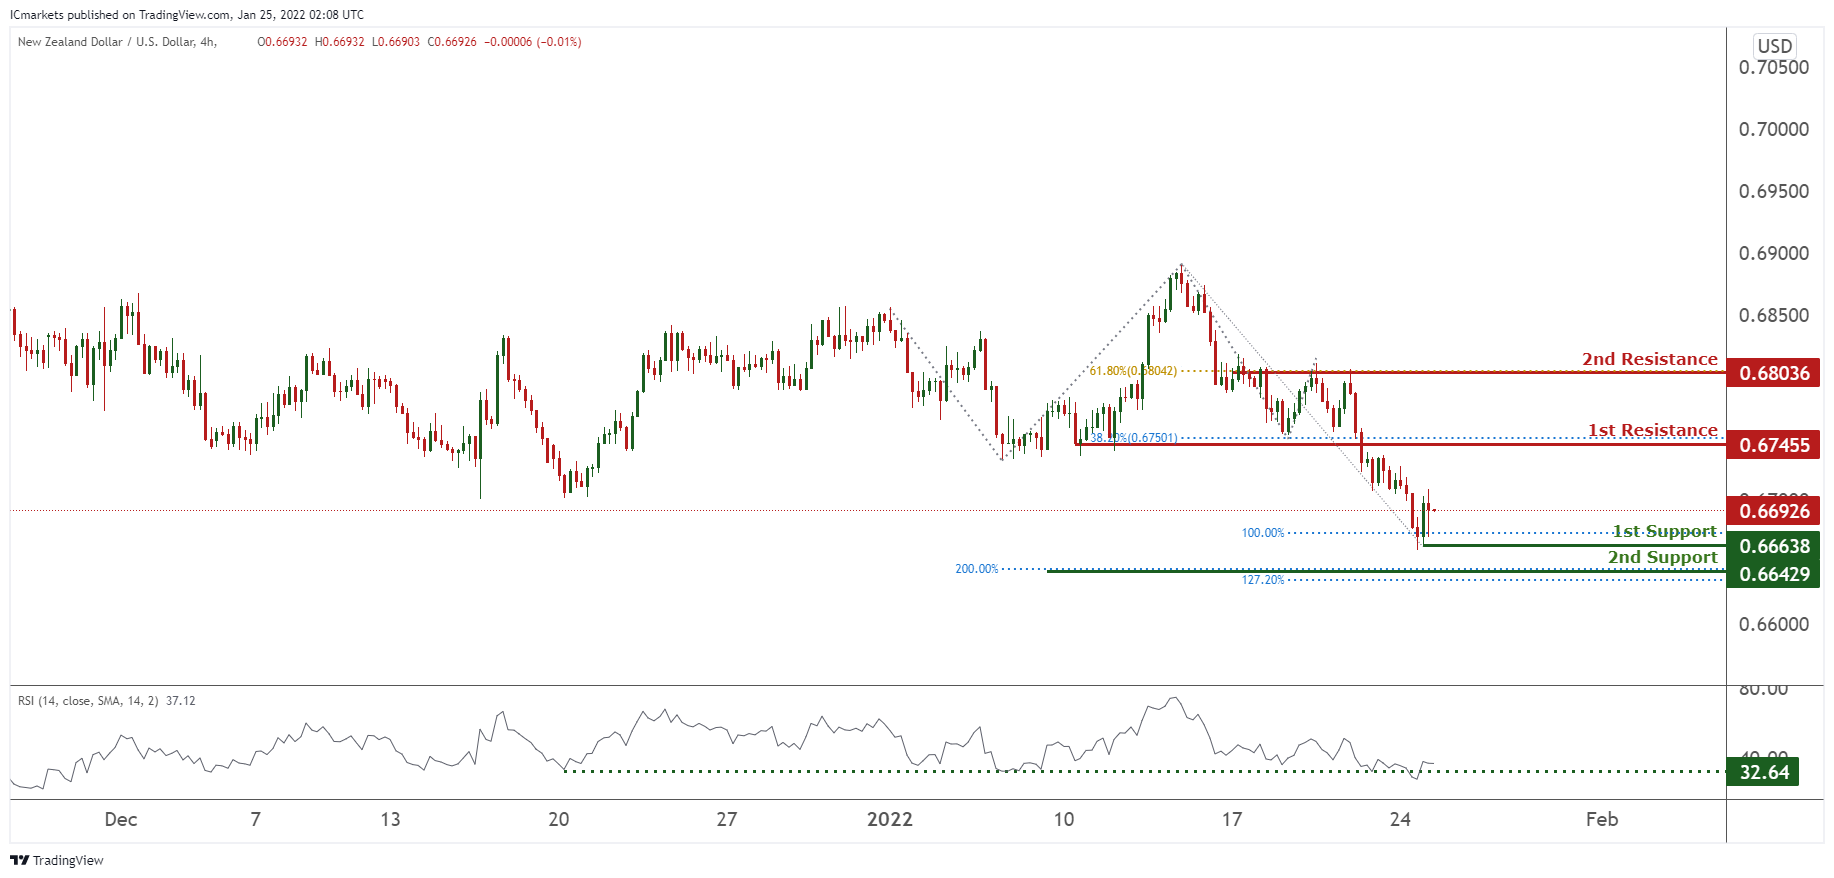
NZD/USD:
On the H4, prices are at a pivot at 0.67455 in line with 38.2% Fibonacci retracement. We see the potential for a bounce from our 1st support at 0.66638 in line with 100% Fibonacci extension towards our 1st resistance at 0.67455 in line with 38.2% Fibonacci retracement. RSI is at a level where bounces occurred previously. Alternatively, our stop loss will be placed at our 2nd support at 0.66429 in line with 200% Fibonacci Projection and 127.2% Fibonacci extension.
Areas of consideration:
- H4 time frame, 1st resistance at 0.67455
- H4 time frame, 1st support at 0.66638
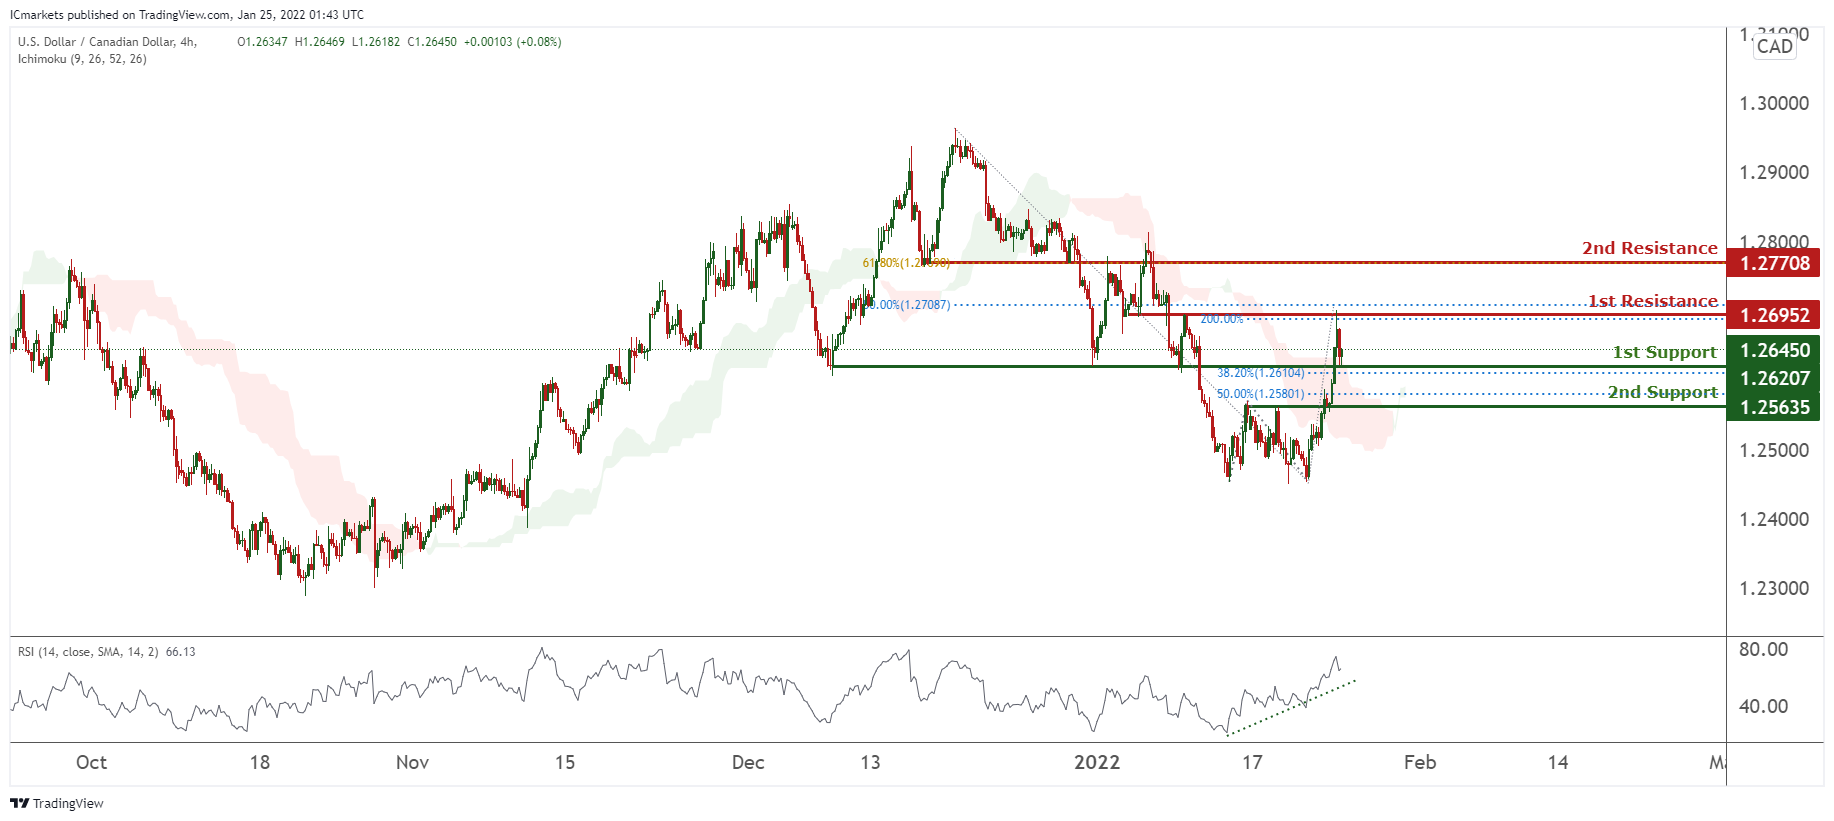
USD/CAD:
On the H4, with prices currently resting on the ichimoku cloud support, we foresee potentially a bullish bounce that price will bounce from our 1st support at 1.26207 which is in line with horizontal overlap resistance and 38.2% Fibonacci retracement to 1st resistance at 1.26952 in line with 200% Fibonacci Projection and 50% Fibonacci retracement, which is a horizontal overlap resistance. Alternatively, price may break 1st support structure and head for 2nd support at 1.25635, in line with 50% Fibonacci retracement. RSI is showing bullish momentum.
Areas of consideration:
- H4 time frame, 1st support at 1.26207
- H4 time frame, 1st resistance at 1.26952
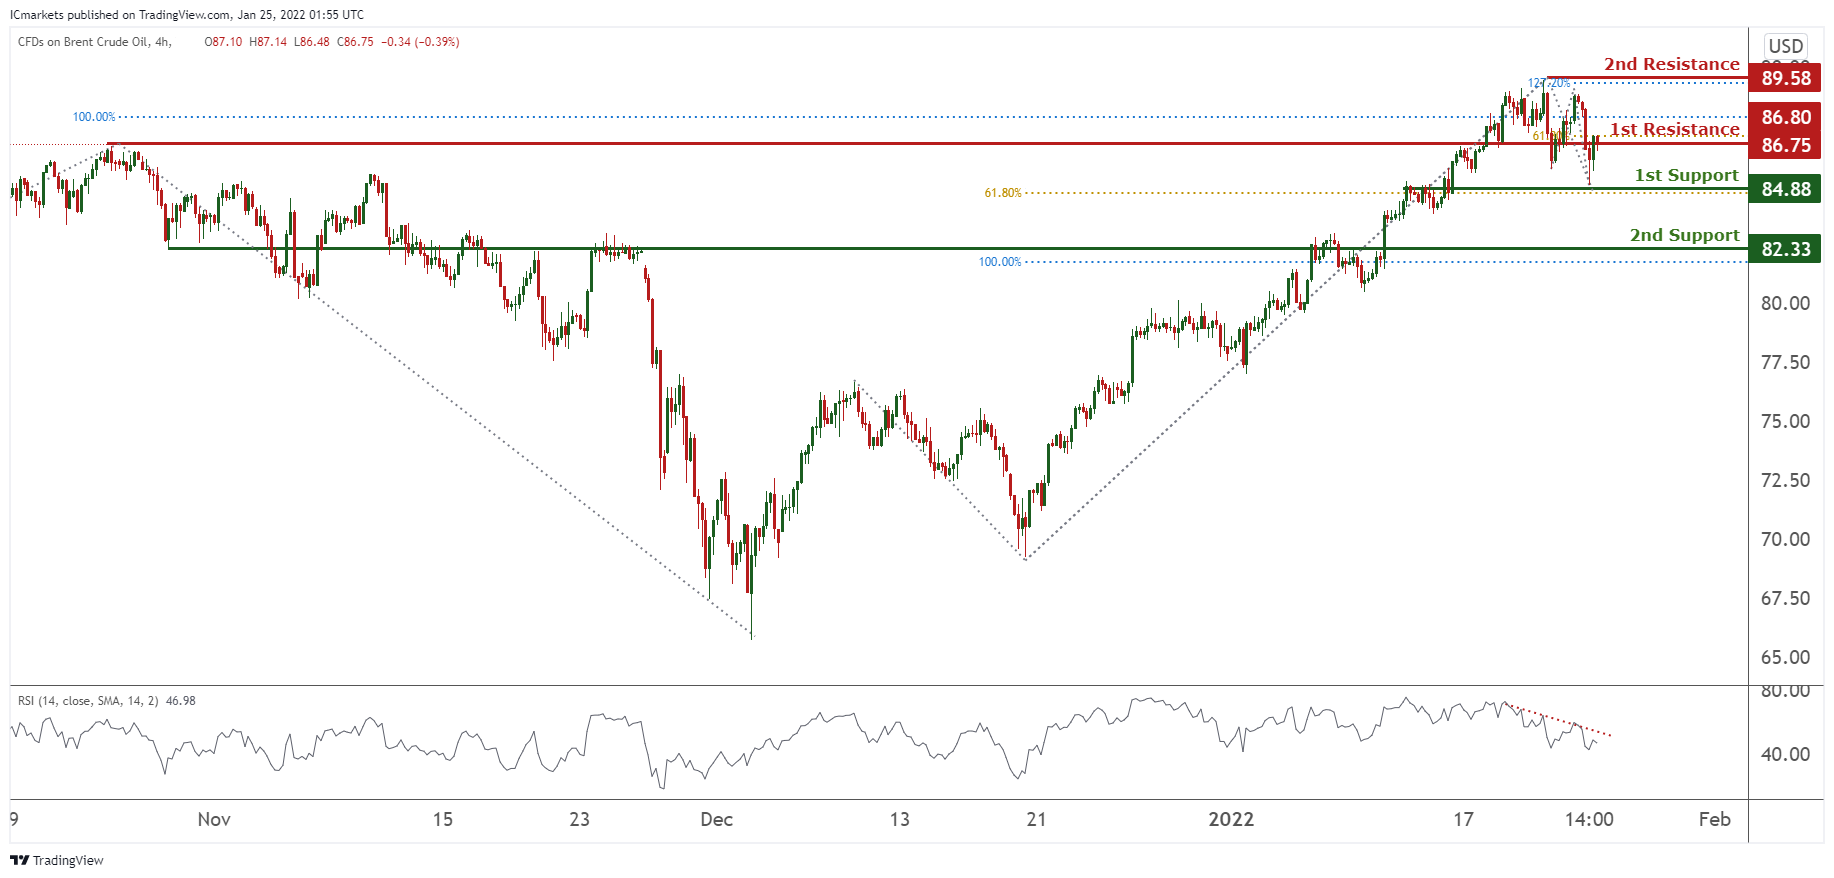
OIL:
On the H4, prices are at an all time high. We expect potentially a trend reversal, and a dip from our 1st resistance at 86.71 in line with 61.8% Fibonacci extension towards our 1st support at 84.88 in line with 61.8% Fibonacci extension. Alternatively, price may break 1st resistance structure and head for 2nd resistance at 89.58, which is graphically swing high and in line with 127.2% Fibonacci extension. RSI is showing bearish momentum.
Areas of consideration:
- H4 time frame, 1st resistance of 86.71
- H4 time frame, 1st support of 84.88
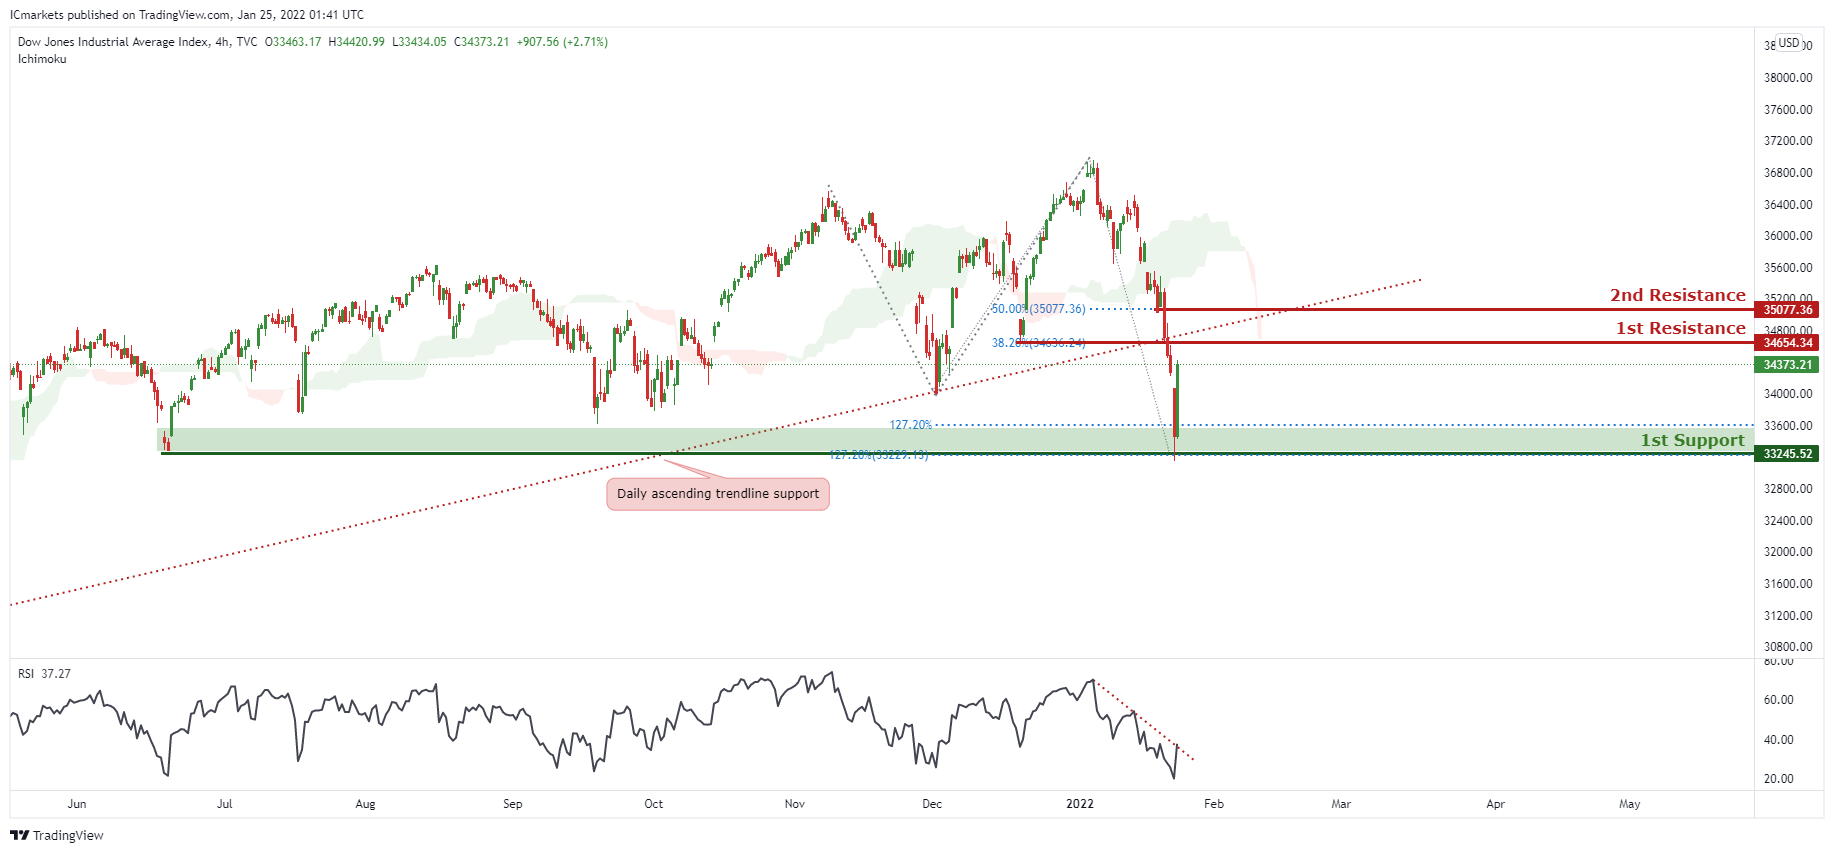
Dow Jones Industrial Average:
On the H4, price broke out of the ascending trendline support,signifying an overall bearish momentum. We can expect price to drop from our 1st resistance in line horizontal graphical overlap and 38.2% Fibonacci retracement towards 1st support in line with horizontal overlap support ,127.2% Fibonacci extension level and 127.2% Fibonacci projection. Alternatively, price may break 1st resistance structure and head for 2nd resistance, which coincides with 50% Fibonacci retracement.
Areas of consideration:
- H4 time frame, 1st resistance of 34654.34
- H4 time frame, 1st support of 33245.52