As price moves back down to retest a major zone, today’s in-play chart is EUR/GBP. But before we move onto today’s level, I want to make sure that we’re up to date with the unfolding narrative in the pair.
Each of the EUR/GBP levels that I’ve blogged about recently have all had an effect on how we got here. The way that price has stepped and reversed has been almost textbook technical behaviour and is worth a look. Go through and click each of the links to our previous EUR/GBP blogs and if you haven’t already been following along, take a look at how we got here.
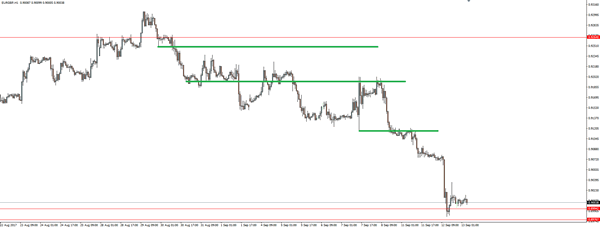
First up, EUR/GBP printed a doji at resistance. As we discussed at the time, this isn’t necessarily a reversal candle, but simply indecision. But as price action unfolded, it turned out to very much be the signal that the sellers were looking for, selling each rally back into previous short term support turned resistance:
EUR/GBP Hourly:

As there weren’t any pullbacks, no matter where you were shorting the level, you really couldn’t have gone wrong… But the green lines I’ve drawn on seem to be the obvious short term support turned resistance that were sold.
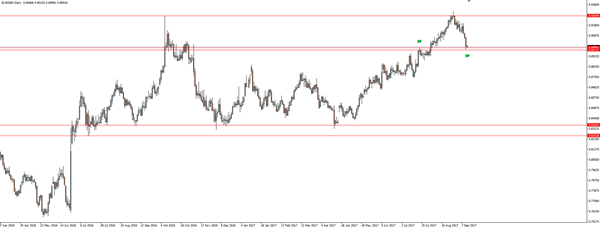
So from here, price continued all the way down until settling back at the previous daily swing high resistance zone that is now conventiently looking to be turning to support:
EUR/GBP Daily:

As always in my trading, this zone is support until it is broken and therefore my bias is to be fading the level. Look for the same patterns (but inverted) as the first daily chart where in this case we’d have short term resistance being turned to support where we’d buy.
Whichever way price decides to go at this zone, this is now the EUR/GBP level that we’ll look to manage our risk around.
