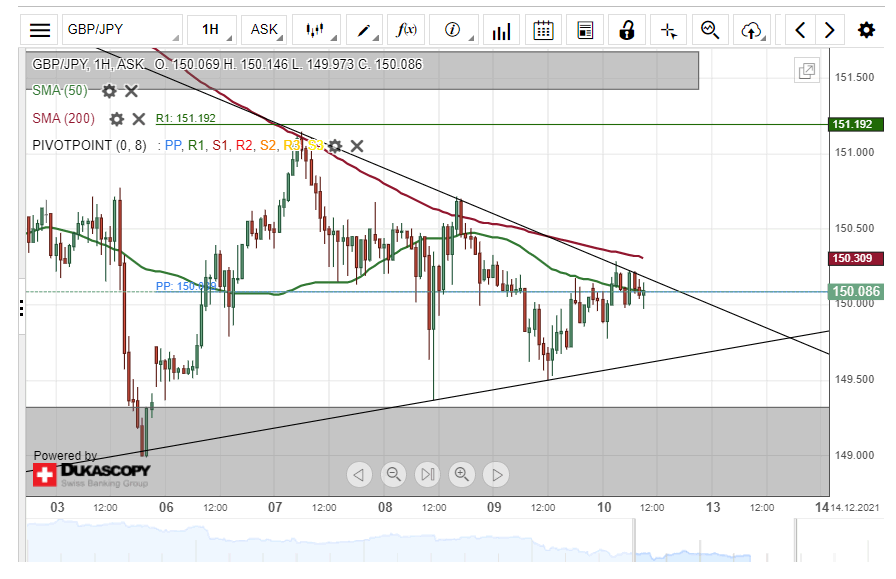
On Friday morning, the GBP/JPY pair passed the resistance of the 50-hour SMA and the weekly simple pivot point near 150.00. However, the surge stopped. After a review, it was discovered that the this week’s high and low levels can be connected to reveal a triangle pattern. Namely, the rate’s surge was stopped by the upper trend line of the triangle.
In theory, trading in a triangle occurs, as volatility and volume reduce. Eventually, an asset or currency exchange rate reaches a point at which either bulls or bears take over and cause a sudden move. Namely, a break out up or down occurs.
A break out to the upside could immediately find resistance in the 200-hour simple moving average near 150.30. Above the SMA, previous high levels could act as resistance at 150.70 and 151.15.
On the other hand, a move down might find support in the 149.50 mark. Below the round exchange rate level, the July, August, September and October low level zone at 148.46/149.30 might stop a decline.