
The EUR/USD currency pair
Technical indicators of the currency pair:
Prev Open: 1.1597
Prev Close: 1.1576
% chg. over the last day: -0.18%
According to Bloomberg Economics, inflation data for September in the Eurozone is likely to be negative. Inflation is expected to be clearly above the European Central Bank’s 2% target in all major economies in the region. German inflation accelerated to 4.1% in September from 3.9% in August, the highest rate since 1993. Unemployment in the Eurozone fell to 7.5% in August.
Trading recommendations
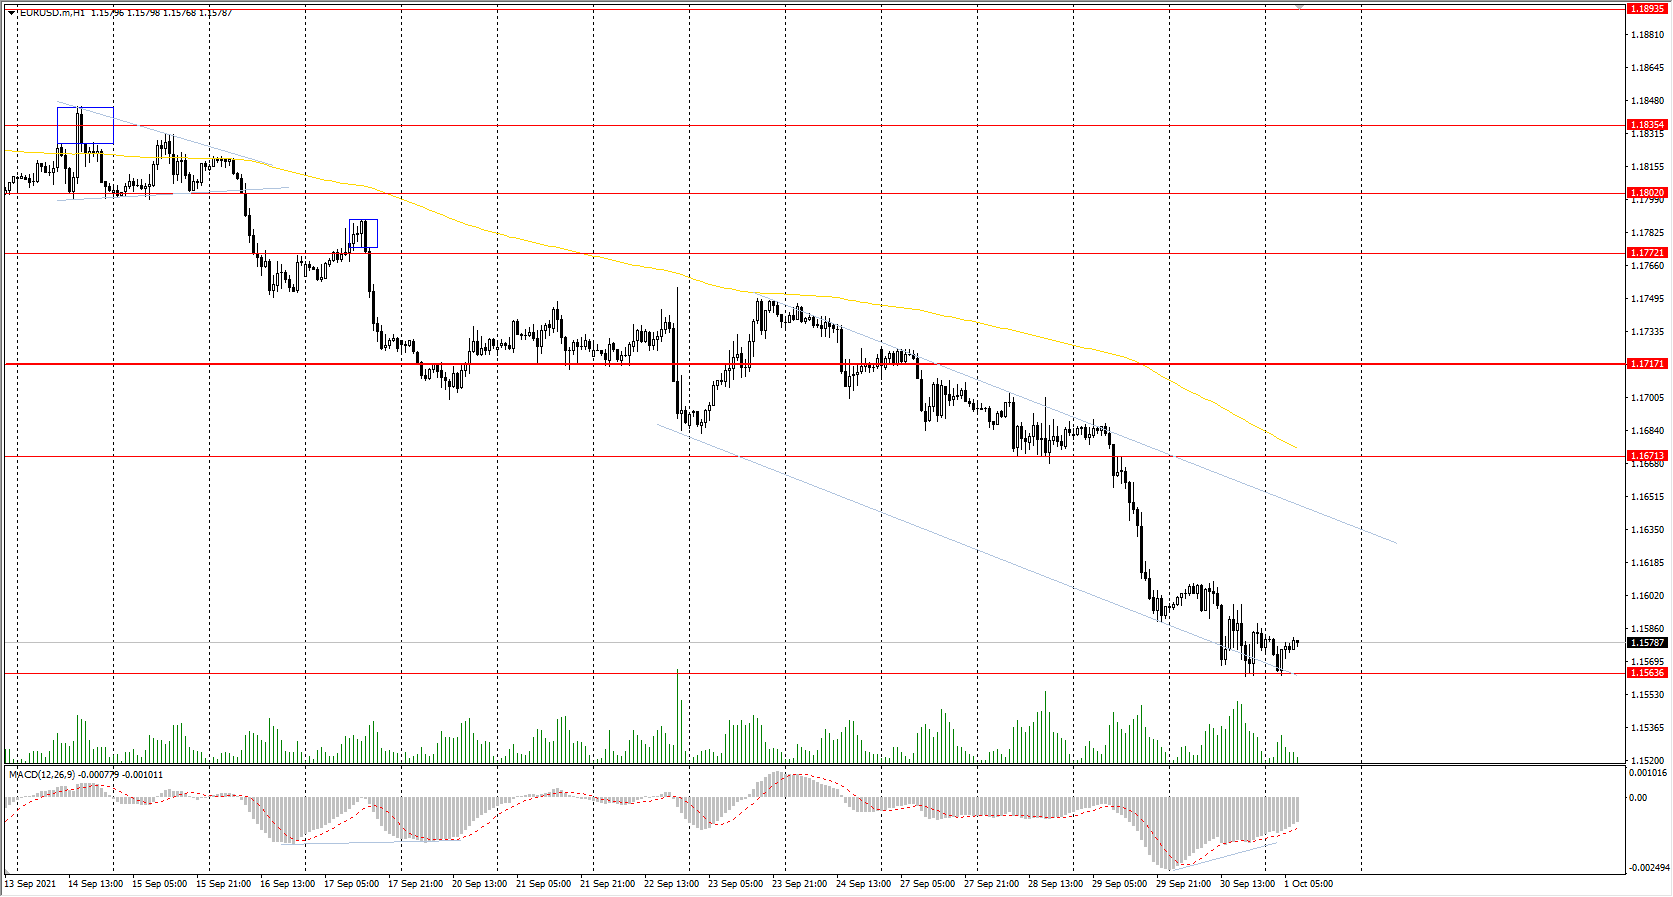
Support levels: 1.1564, 1.1453
Resistance levels: 1.1671, 1.1717, 1.1772, 1.1802, 1.1835
From the technical point of view, the EUR/USD trend has changed to bearish. On the background of the weakness of the European currency, the quotes went down sharply. The price has consolidated below the priority change level. But the MACD indicator shows a divergence. Under such market conditions, traders should consider sell deals from the resistance levels near the moving average, as the price has deviated from the middle line. Buy trades should be considered only from the support levels with additional confirmation in the form of a buyers’ initiative.
Alternative scenario: if the price breaks out through the 1.1717 resistance level and fixes above, the mid-term uptrend will likely resume.
News feed for 2021.10.01:
- German Manufacturing PMI (m/m) at 10:55 (GMT+3);
- Eurozone Manufacturing PMI (m/m) at 11:00 (GMT+3);
- Eurozone Consumer Price index (m/m) at 12:00 (GMT+3);
- US PCE price index (m/m) at 15:30 (GMT+3);
- US ISM Manufacturing PMI (m/m) at 17:00 (GMT+3);
- US Michigan Consumer Sentiment (m/m) at 17:00 (GMT+3).
The GBP/USD currency pair
Technical indicators of the currency pair:
Prev Open: 1.3425
Prev Close: 1.3470
% chg. over the last day: +0.33%
In the UK, 15 power companies, providing services to about 2 million people, have gone bankrupt since the beginning of the year because of high gas prices. But the situation with fuel shortages at gas stations is improving. The British GDP increased to 5.5% (previous 4.8%) in annual terms.
Trading recommendations
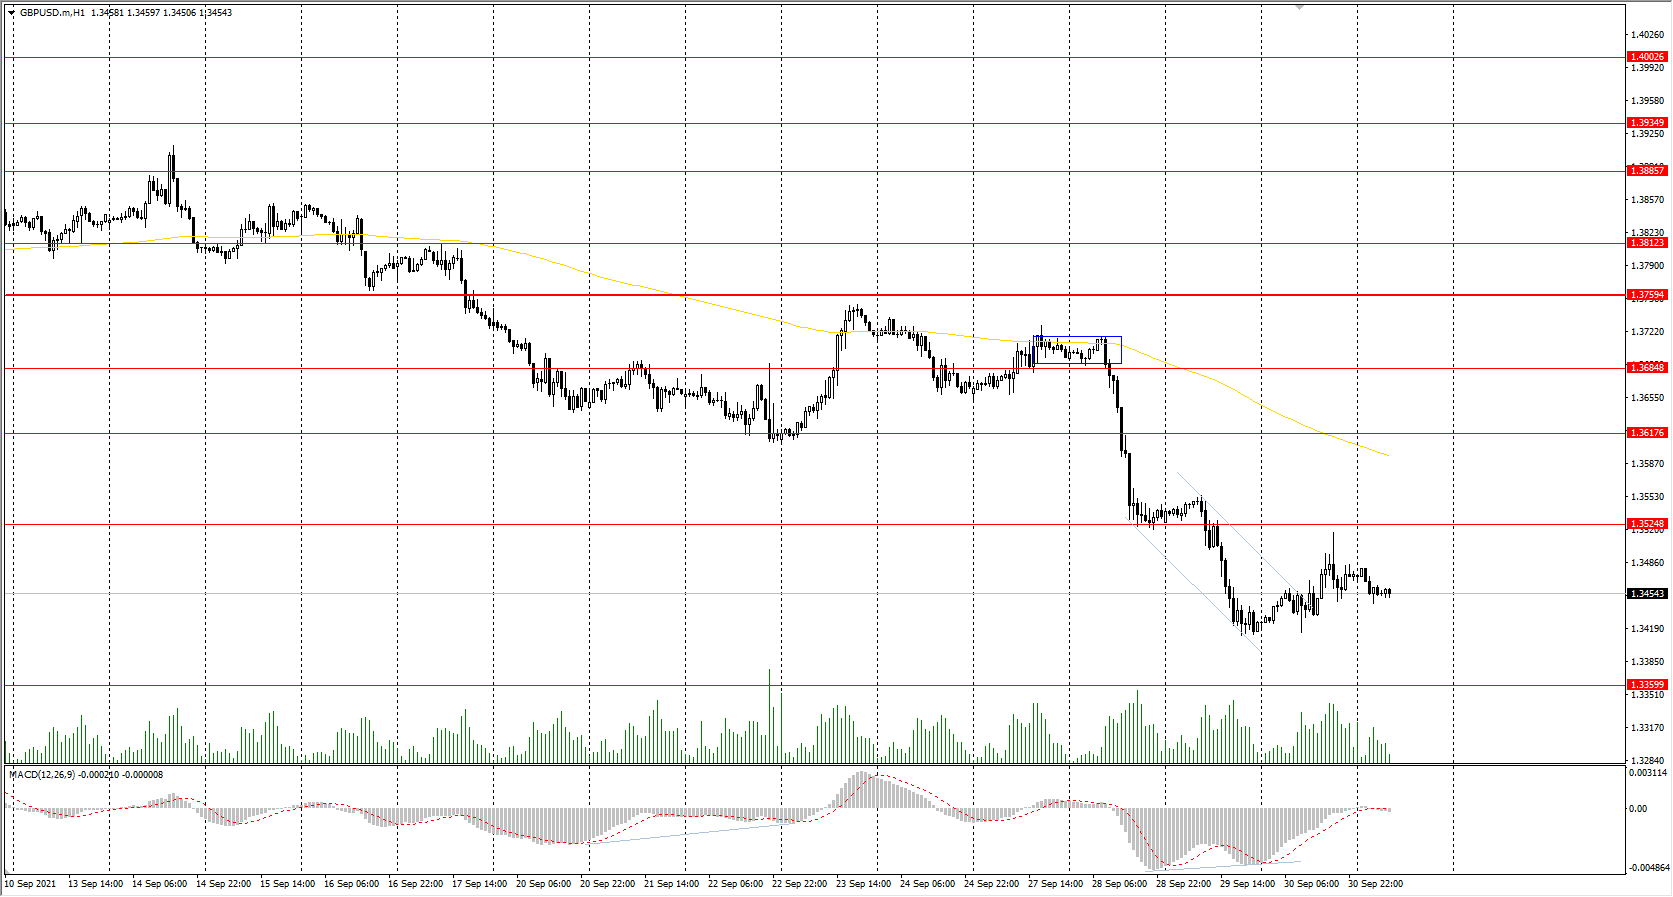
Support levels: 1.3360, 1.3282
Resistance levels: 1.3525, 1.3617, 1.3685, 1.3759, 1.3812, 1.3886
On the hourly time frame, the GBP/USD trend is bearish. The MACD indicator has become negative. Buy trades should be considered only throughout the day and only with short targets from the support levels after the buyer’s initiative. Sell trades can be found at the resistance levels near the moving average line, as the price has deviated from the average values.
Alternative scenario: if the price breaks out through the 1.3759 resistance level and consolidates above, the bullish scenario will likely resume.
News feed for 2021.10.01:
- UK Manufacturing PMI (m/m) at 11:30 (GMT+3).
The USD/JPY currency pair
Technical indicators of the currency pair:
Prev Open: 111.95
Prev Close: 111.25
% chg. over the last day: -0.63%
Last month, Japan’s unemployment rate remained at 2.8% (forecast 2.9%), but the business activity index unexpectedly increased. With the removal of restrictions, this indicator is going to improve. Japan’s new Prime Minister, Kishida, intends to dissolve the parliament on October 14.
Trading recommendations
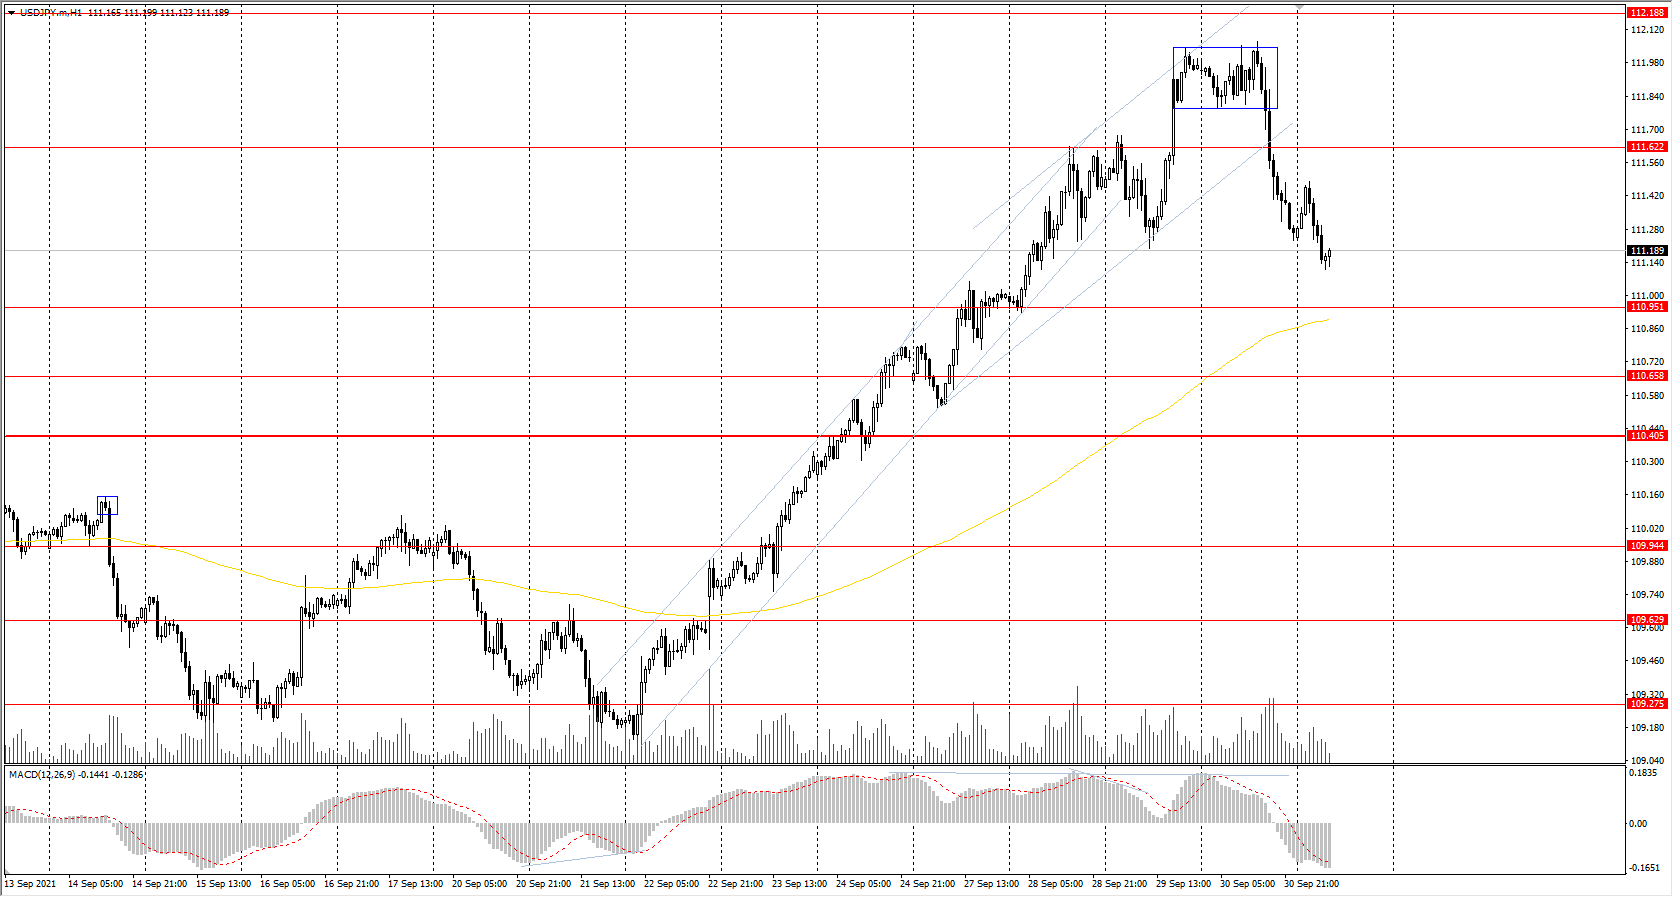
Support levels: 110.95, 110.65, 110.40, 109.95, 109.63, 109.27
Resistance levels: 111.62, 112.19
The main trend of the USD/JPY currency pair is bullish. The MACD indicator became negative, and the correction started. Under such market conditions, it’s better to look for buy positions from the support levels near the moving average. Sell positions should be considered only throughout the day from the resistance levels, given there is sellers’ initiative.
Alternative scenario: if the price falls below 110.45, the uptrend is likely to be broken.
News feed for 2021.10.01:
- Japan Unemployment Rate (m/m) at 02:30 (GMT+3);
- Japan Tankan Manufacturing Index (m/m) at 02:50 (GMT+3).
The USD/CAD currency pair
Technical indicators of the currency pair:
Prev Open: 1.2751
Prev Close: 1.2682
% chg. over the last day: -0.54 %
The Canadian dollar is a commodity currency, so USD/CAD is highly dependent on the dynamics of the dollar index and oil prices. The dollar index remained at the same level yesterday while oil prices increased. As a result, the USD/CAD quotes decreased due to the strengthening of the Canadian currency.
Trading recommendations
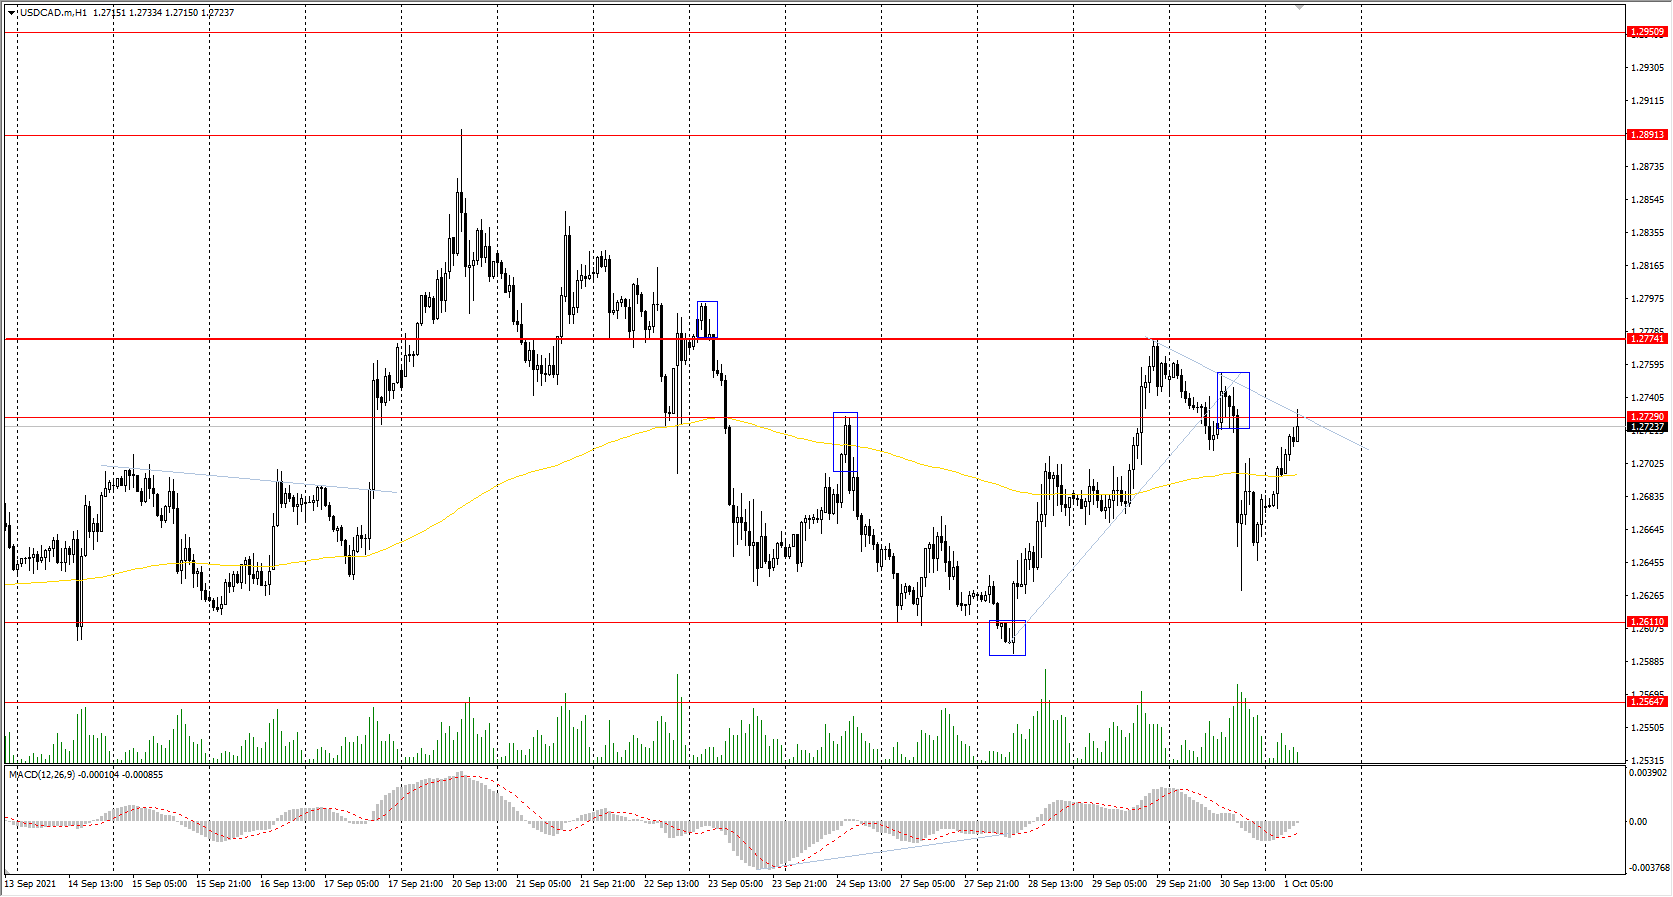
Support levels: 1.2611, 1.2565, 1.2518, 1.2425
Resistance levels: 1.2729, 1.2774, 1.2891
From the technical point of view, the trend of the USD/CAD currency pair is bearish. But the price is trading in a wide corridor now. The MACD indicator has become inactive. Under such market conditions, it is better to look for buy deals from the support levels, but only with short targets. It is best to look for sell deals from the resistance levels after the sellers’ initiative, such as an impulse movement.
Alternative scenario: if the price breaks out through the 1.2774 resistance level and fixes above, the uptrend will likely resume.
News feed for 2021.10.01:
- Canada GDP (m/m) at 15:30 (GMT+3).