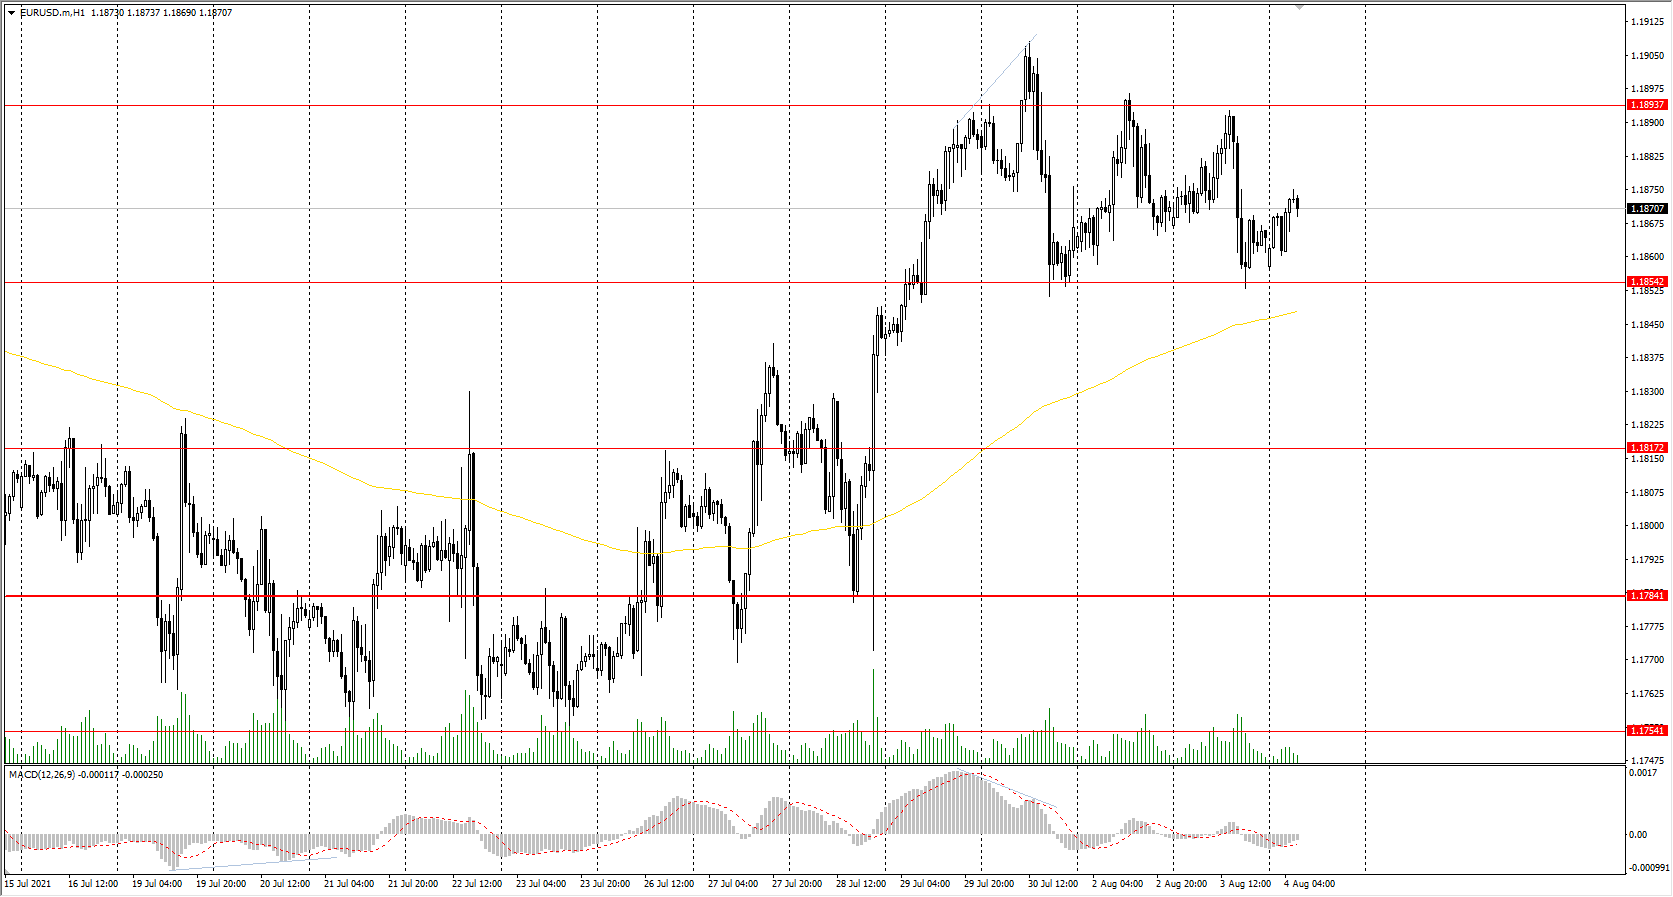
The EUR/USD currency pair
Technical indicators of the currency pair:
Prev Open: 1.1867
Prev Close: 1.1864
% chg. over the last day: -0.03%
The situation with the EUR/USD currency pair has not changed compared to the previous day. Yesterday, during the European session the quotes were slowly growing, but during the American session the price sharply fell to the opening level of the day. From a fundamental point of view, the European economy demonstrates stable recovery dynamics now.
Trading recommendations
Support levels: 1.1854, 1.1817, 1.1784, 1.1754, 1.1609
Resistance levels: 1.1894, 1.1934, 1.1969
From a technical point of view, the general trend of the EUR/USD currency pair is bullish. The price is trading above the moving average now; the MACD indicator has become inactive. The price has consolidated and is in the middle of the trading range now. Under such market conditions, it’s better to consider intraday trading. Buy positions should be considered only after a pullback to the support level. Sell deals should be considered from the resistance levels, but only with short targets.
Alternative scenario: if the price breaks through the 1.1784 support level and fixes below, the mid-term uptrend is likely to be broken.
News feed for 2021.08.04:
- Eurozone Services PMI (m/m) at 11:00 (GMT+3);
- US ADP Non-Farm Employment Change (m/m) at 15:15 (GMT+3);
- US ISM Services PMI (m/m) at 17:00 (GMT+3).
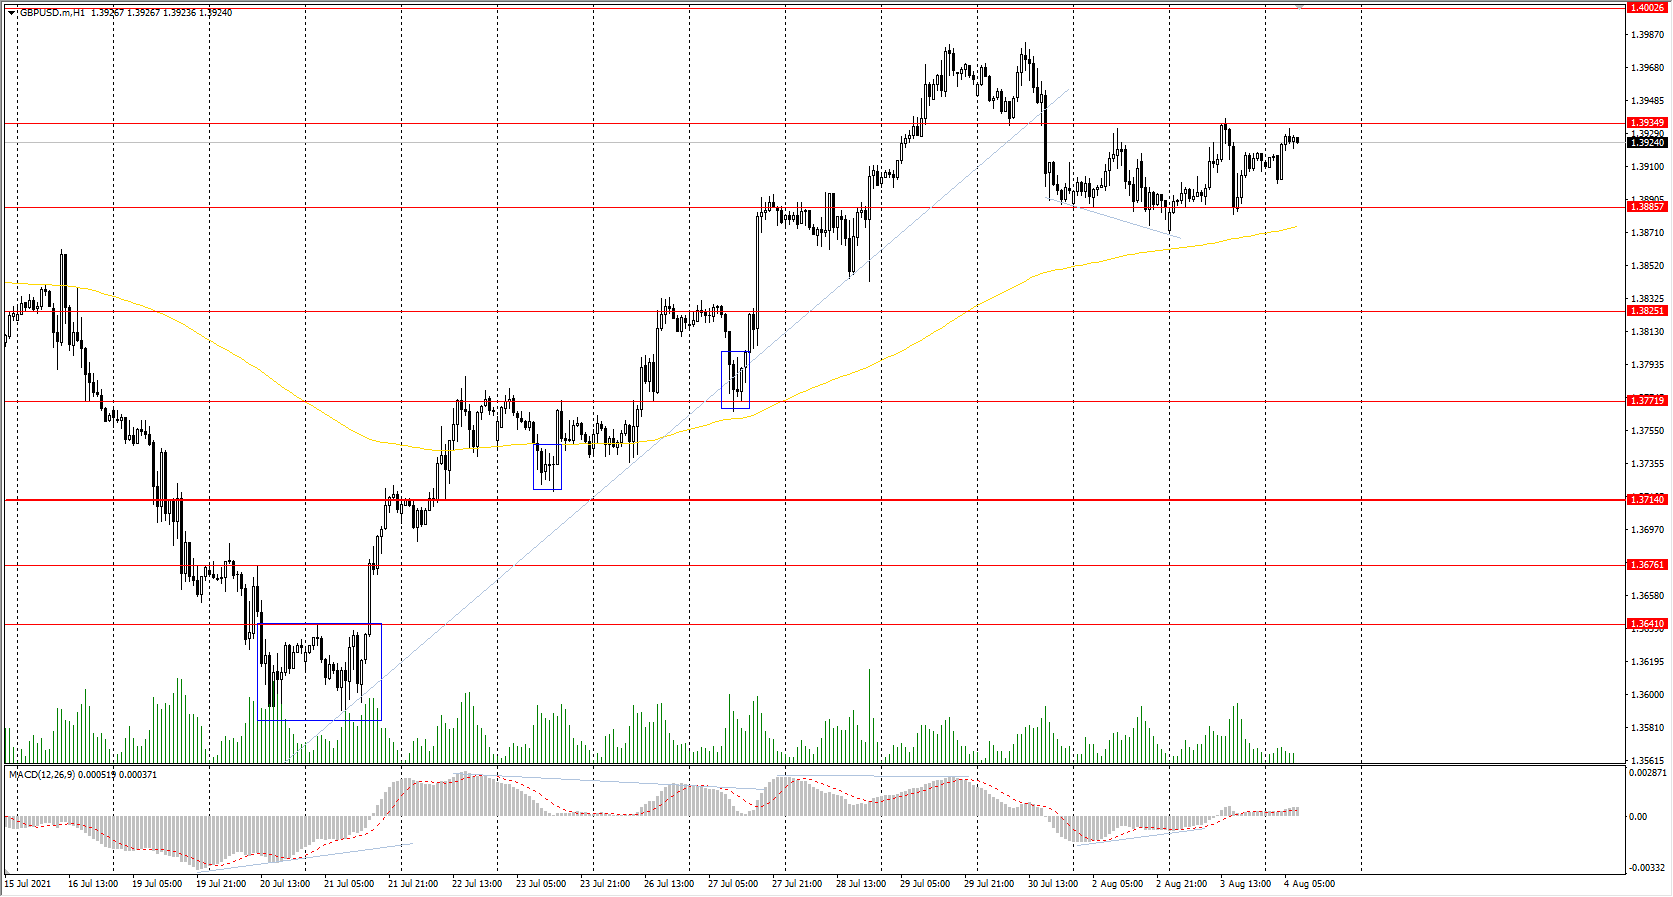
The GBP/USD currency pair
Technical indicators of the currency pair:
Prev Open: 1.3873
Prev Close: 1.3913
% chg. over the last day: +0.29%
The situation with the GBP/USD currency pair is very similar to the euro. The price has consolidated and formed a trading range. Unlike the euro, the British pound gained a more confident position. But the probability of a corrective wave down is high with both instruments now.
Trading recommendations
Support levels: 1.3886, 1.3825, 1.3772, 1.3714, 1.3676 ,1.3641, 1.3614, 1.3525
Resistance levels: 1.3935, 1.4002, 1.4075, 1.4101
On the hour timeframe, the trend of the GBP/USD currency pair is bullish. The MACD indicator has become positive again, but the price is in the middle of a corridor. Under such market conditions, traders are better to look for buy trades, after buyers show initiative. There are no optimal points for sell positions right now. Traders can search for intraday sell entries from the resistance level with short targets, but they should understand that it will be trading against the main trend.
Alternative scenario: if the price breaks through the 1.3714 support level and consolidates below, the bearish scenario is likely to resume.
News feed for 2021.08.04:
- UK Services PMI (m/m) at 11:30 (GMT+3).
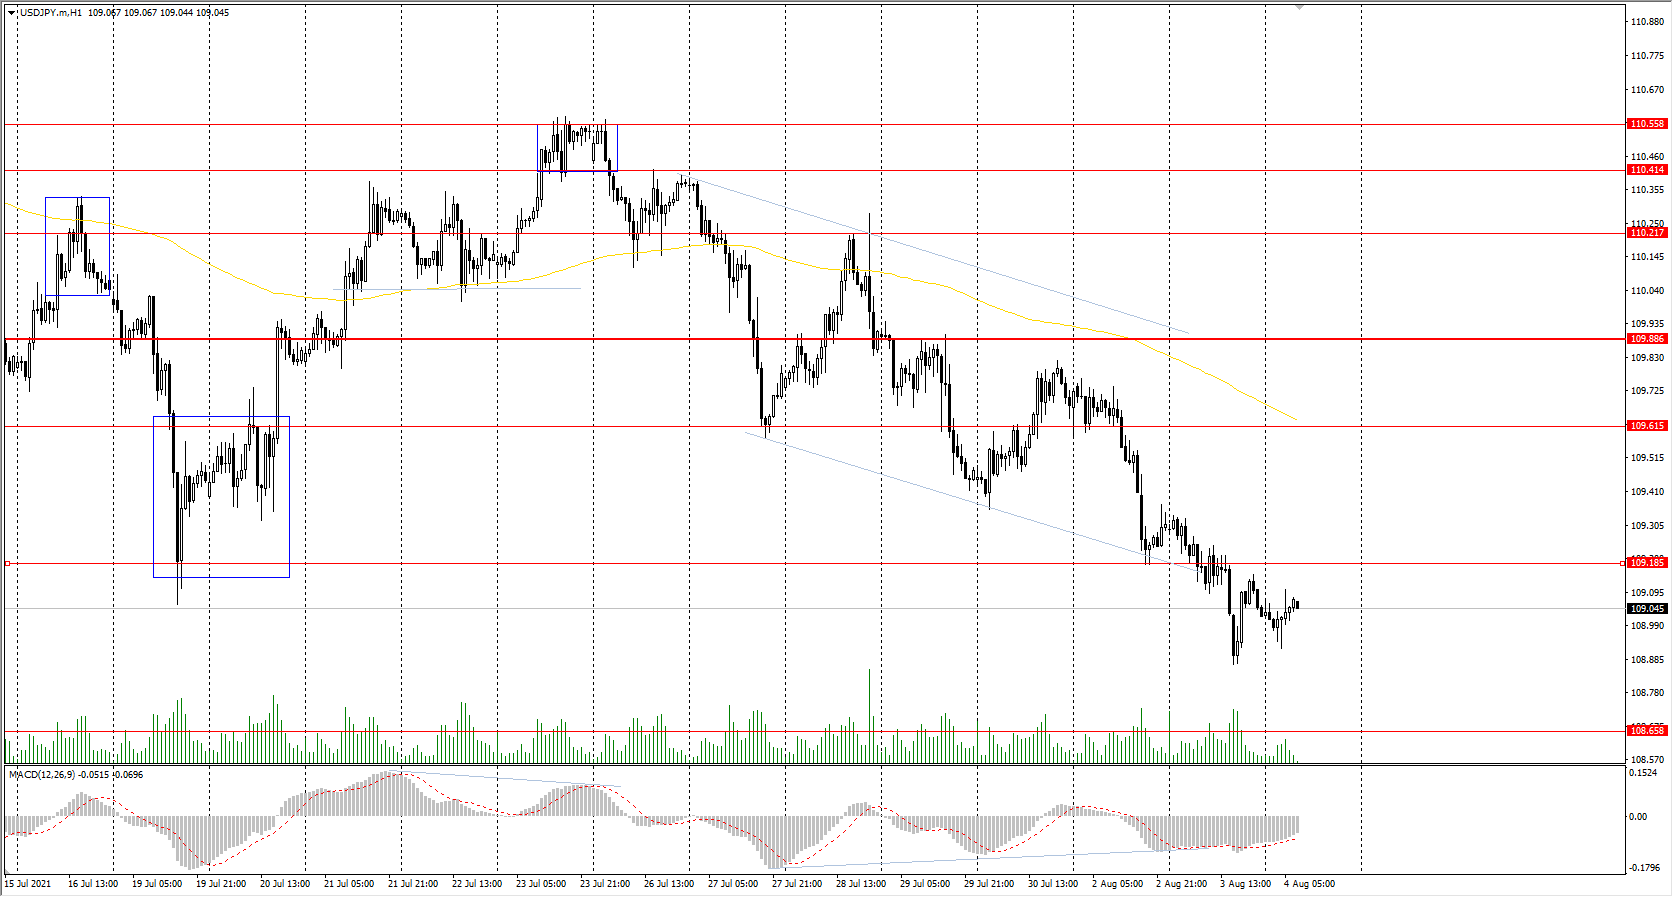
The USD/JPY currency pair
Technical indicators of the currency pair:
Prev Open: 109.29
Prev Close: 109.02
% chg. over the last day: -0.25%
The USD/JPY currency pair is declining. Yesterday, the quotes decreased by another 0.25%. The strengthening of the Japanese currency is associated with the growth of the futures on the Japanese yen (inverse correlation).
Trading recommendations
Support levels: 108.65
Resistance levels: 109.19, 109.61, 109.88, 110.22, 110.41, 110.56
The main trend of the USD/JPY currency pair is bearish. The price is trading below the moving average now, but it has deviated strongly from the middle line. Considering the divergence on the MACD indicator, traders can look for buy positions, but only after buyers’ initiative. For sell positions, it is necessary to wait for a pullback to the resistance level, which is close to the moving average.
Alternative scenario: if the price rises above 109.88, the uptrend is likely to be resumed.
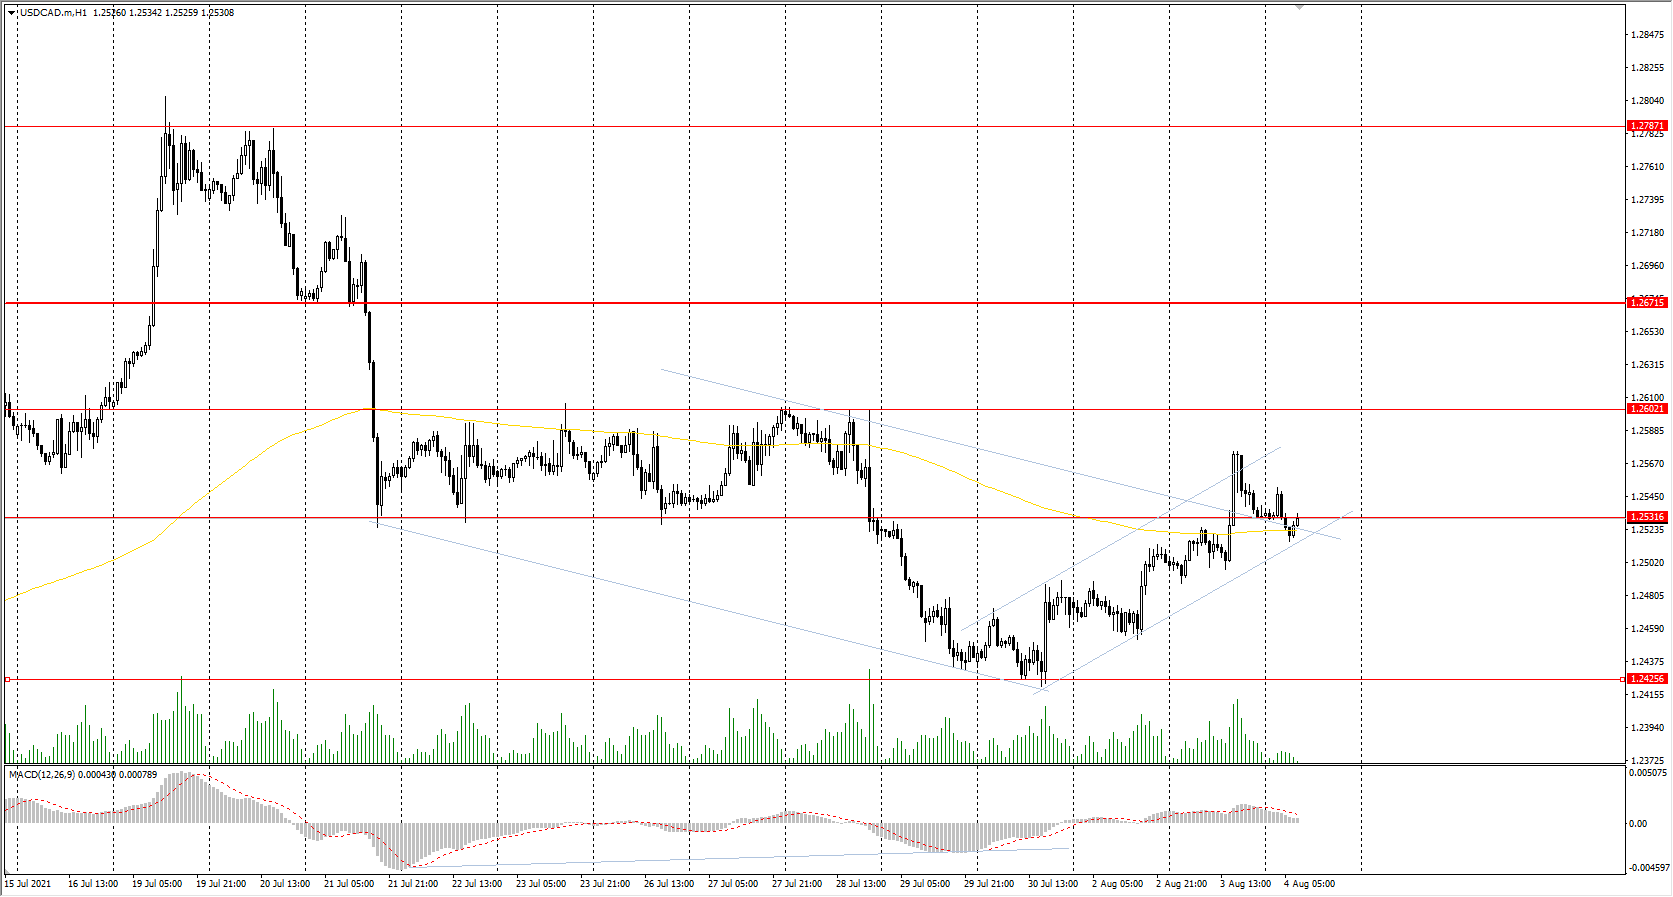
The USD/CAD currency pair
Technical indicators of the currency pair:
Prev Open: 1.2503
Prev Close: 1.2532
% chg. over the last day: +0.23%
The Canadian dollar is highly dependent on the dollar index and the oil price dynamics. Oil prices continued to fall yesterday, which caused a decline in the Canadian dollar futures and the growth of USD/CAD quotes (inverse correlation). Analysts expect some stabilization in oil prices now, but today traders should pay attention to crude oil inventories data.
Trading recommendations
Support levels: 1.2531, 1.2425, 1.2370, 1.2312
Resistance levels: 1.2602, 1.2671, 1.2787, 1,2951
Considering technical analysis, the USD/CAD trend is bearish. The MACD indicator has become inactive again. Under such market conditions, traders should look for sell positions from the resistance levels after sellers show initiative. Buy positions can be considered only throughout the day and only with short targets.
Alternative scenario: if the price breaks through the 1.2671 resistance level and fixes above, the uptrend is likely to be resumed.