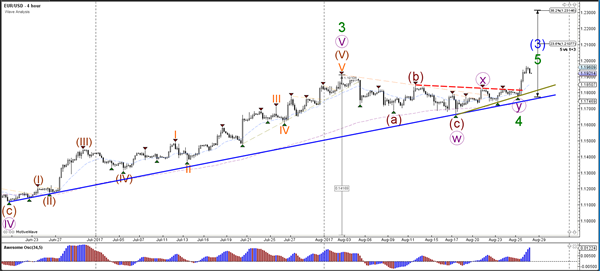
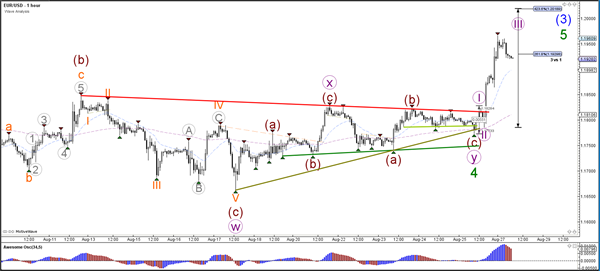
Currency pair EUR/USD
The EUR/USD did break above the resistance trend line (dotted red) of the triangle chart pattern as expected. This breakout is a continuation of wave 5 (green) of wave 3 (blue). The first target is the round level of 1.20, which could cause a retracement.
The EUR/USD bullish breakout is building an internal 5 wave (purple) and is currently in a wave 3 (purple).
Currency pair USD/JPY
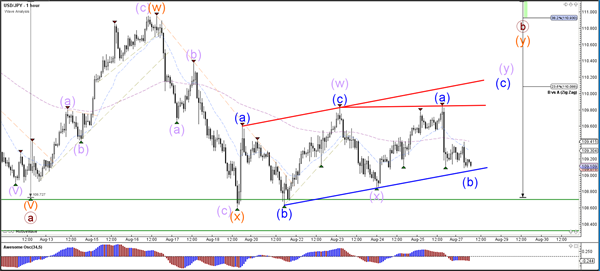
The USD/JPY remains caught in between support (green lines) and resistance (orange). A bounce could see price move higher towards the Fib levels of wave B vs A whereas a bearish break could indicate a downtrend continuation.
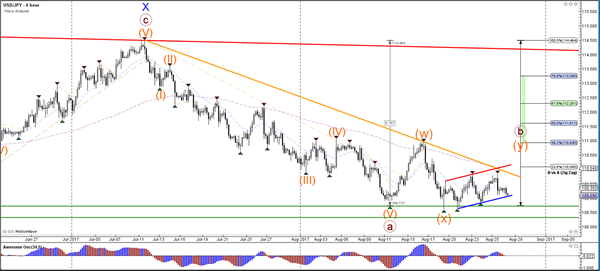
The USD/JPY is building a channel (red/blue lines) at the support zone (green).
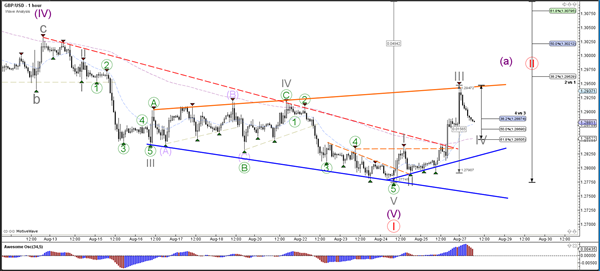
Currency pair GBP/USD
The GBP/USD bullish breakout indeed took place as expected and started wave A (purple) of a larger wave 2 (red) correction.
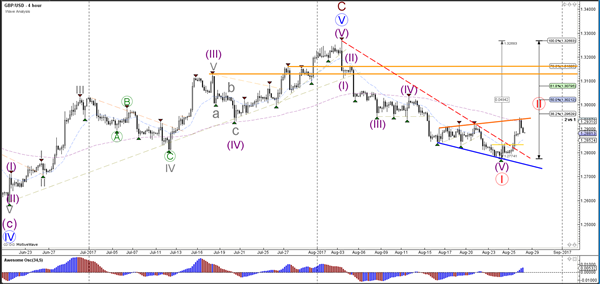
The GBP/USD could have completed an ABC wave (purple) at the recent high or it could be building a wave 4-5 within wave A (purple). This depends on whether price will bounce at the 61.8% Fibonacci level of wave 4 vs 3.