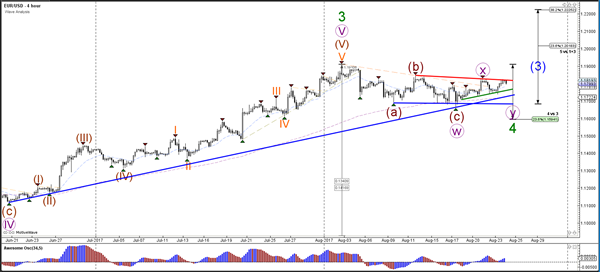
Currency pair EUR/USD
The EUR/USD is challenging the resistance trend line (red) of the bull flag chart pattern. At the moment it is unable to break and a correction back to the support trend lines is possible. The next breakout above resistance (red) of the contracting triangle pattern should see the continuation of wave 3 (blue).
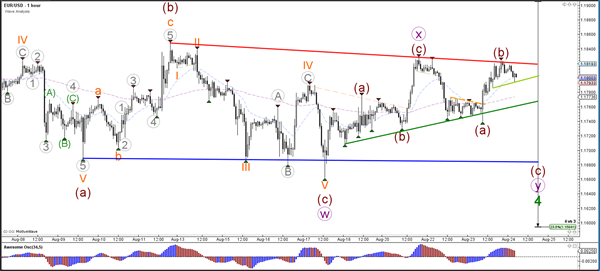
The EUR/USD has arrived at a break spot. A break below support (light green) could see price challenge the bigger support zones (green/blue) and perhaps even the 23.6% Fib of wave 4 vs 3, whereas a break above resistance could lead to an uptrend continuation. There is the possibility of an ABC (brown) correction before wave 4 (green) is ready but a break above the major resistance (red) would invalidate that and indicate a potential bullish breakout.
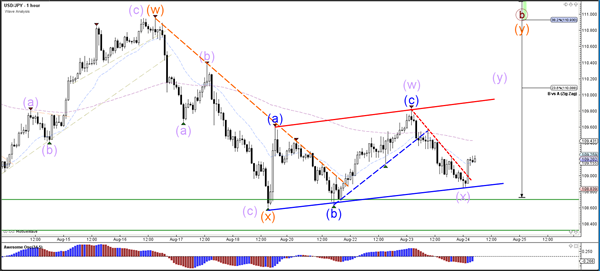
Currency pair USD/JPY
The USD/JPY is again retesting the support zone (green lines). A bounce could see price move higher towards the Fib levels of wave B vs A whereas a bearish break could indicate a downtrend continuation.
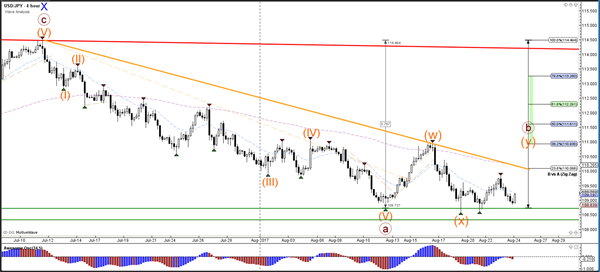
The USD/JPY is building a channel (red/blue lines) at the support zone (green).
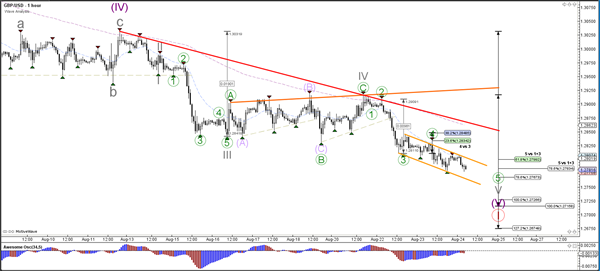
Currency pair GBP/USD
The GBP/USD is moving lower within the downtrend channel (red). The round quarter level of 1.2750 could act as a support zone.
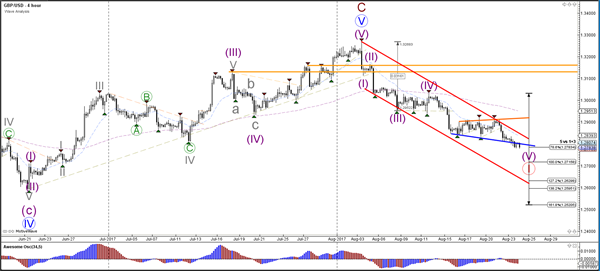
The GBP/USD indeed completed a wave 4 (green) correction and is moving lower in a smaller channel (orange lines).