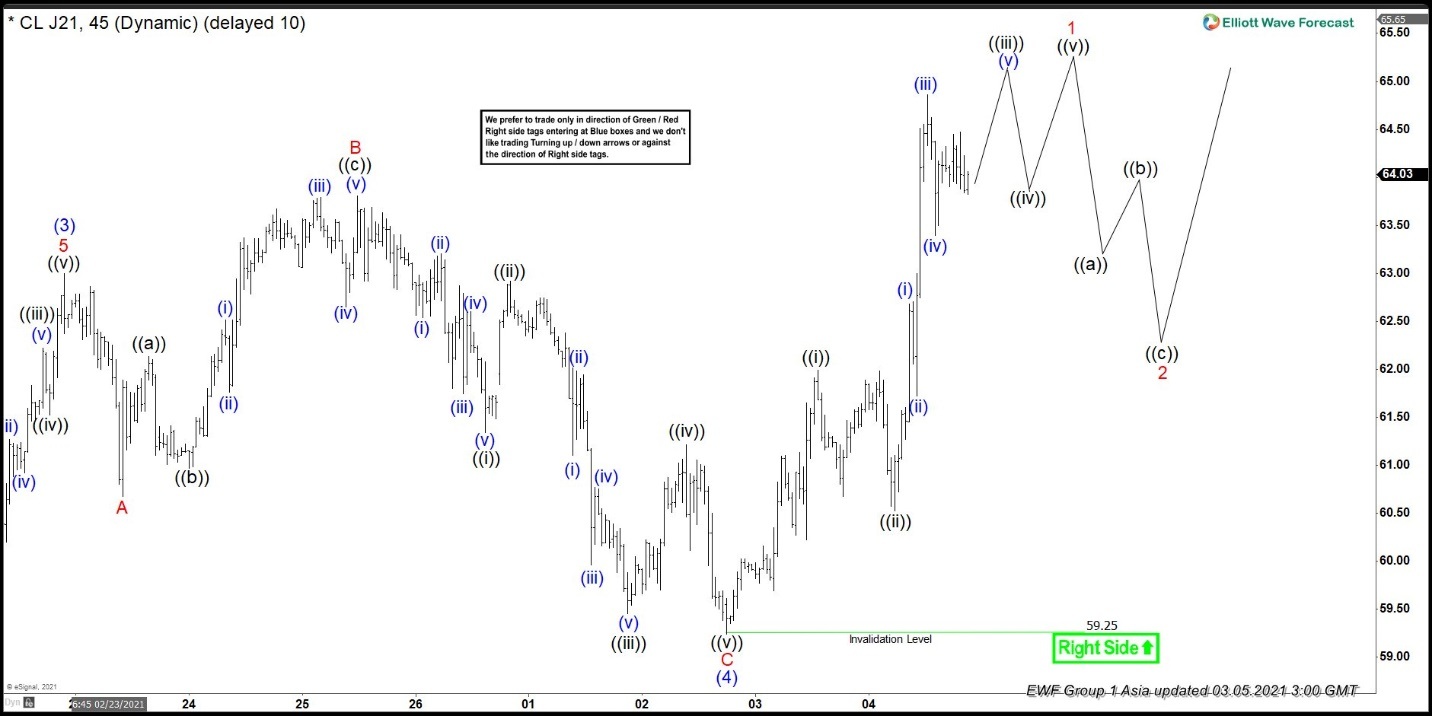
Elliott Wave in Oil (CL) suggests the rally from April 23, 2020 low is unfolding as an impulse Elliott Wave structure. It is currently still ending wave ((3)) from April 23, 2020 low. Within wave ((3)) subdivision, it’s now in the wave (5). Short term 45 minutes chart below shows the rally to 63 ended wave (3) of ((3)). Pullback in wave (4) of ((3)) has ended at 59.32. Internal of wave (4) unfolded as an expanded Flat where wave A ended at 60.64, wave B ended at 63.81, and wave C ended at 59.32.
Oil has broken above the previous wave B of (4) peak at 63.81, suggesting the next leg higher in wave (5) has started. Up from wave (4) low, wave ((i)) ended at 61.99 and pullback in wave ((ii)) ended at 60.52. Expect oil to extend higher 2 more time to end wave 1 of (5). Afterwards, it should pullback in wave 2 to correct cycle from March 3 low before the rally resumes. As far as pivot at 59.32 low stays intact, expect dips to find support in 3, 7, or 11 swing for further upside.
Oil 45 Minutes Elliott Wave Chart