
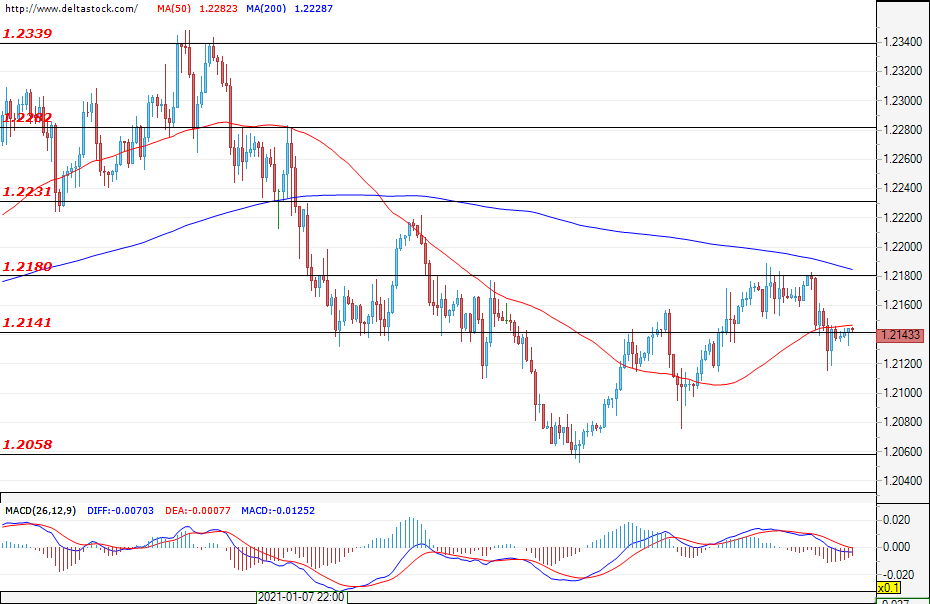
EUR/USD
Current level – 1.2143
The pair is testing the support at around 1.2140 and, if the level holds, the next zones around 1.2180 and 1.2230 could enter the buyers’ crosshair. A breach above 1.2180 could be interpreted as an early signal telling us that the pullback above 1.2340 has ended. If this is the case, the first resistance zones are found at 1.2230 and at 1.2280, with the main target still being the level of 1.2340. The key support, which is expected to hold the pullback, remains at 1.2060. Today, an increase in volatility can be expected around the announcement of the consumer confidence index for the United States (15:00 GMT). The market could remain without a clear direction until the announcement of the Fed interest rate decision this Wednesday at 19:00 GMT.
| Resistance | Support | ||
| intraday | intraweek | intraday | intraweek |
| 1.2180 | 1.2280 | 1.2140 | 1.2060 |
| 1.2230 | 1.2340 | 1.2060 | 1.1950 |
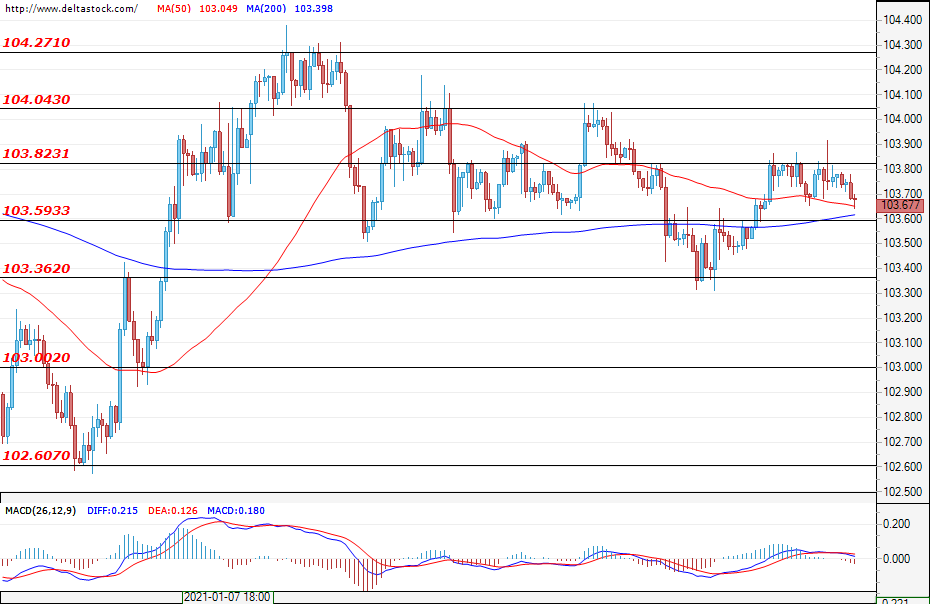
USD/JPY
Current level – 103.67
The Greenback is holding steady in the beginning of this week and the market still struggles to find a direction. Trading could continue in the range between the 103.60 support and the 104.27 resistance zones. If bears fail to reach a new local low, bulls might take the initiative and charge 104.27 once again. The small consolidation just below 103.82 signals for position accumulation and a breach of both 103.82 and 103.60 is possible. If the support fails to hold, short sellers could take off and lead the pair towards the support at 102.60.
| Resistance | Support | ||
| intraday | intraweek | intraday | intraweek |
| 103.82 | 104.27 | 103.59 | 103.01 |
| 104.04 | 104.58 | 103.36 | 102.60 |
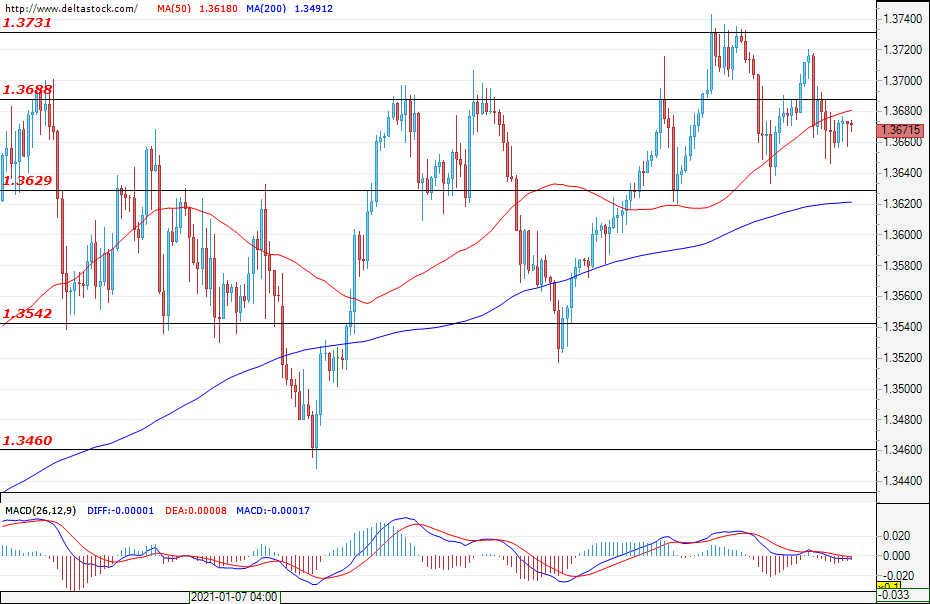
GBP/USD
Current level – 1.3671
The bulls failed once again to hold prices above the 1.3688 level. It seems that buyers are running out of steam and the support near 1.3630 could be tested again. The sell-off could become deeper and bears might head towards 1.3540 or even 1.3460. While a sudden drop like that isn’t expected to jeopardise the trend coming from the higher time frames, if the support of the range becomes violated, a sudden shift in market sentiment is possible.
| Resistance | Support | ||
| intraday | intraweek | intraday | intraweek |
| 1.3690 | 1.3800 | 1.3630 | 1.3460 |
| 1.3730 | 1.3860 | 1.3540 | 1.3460 |