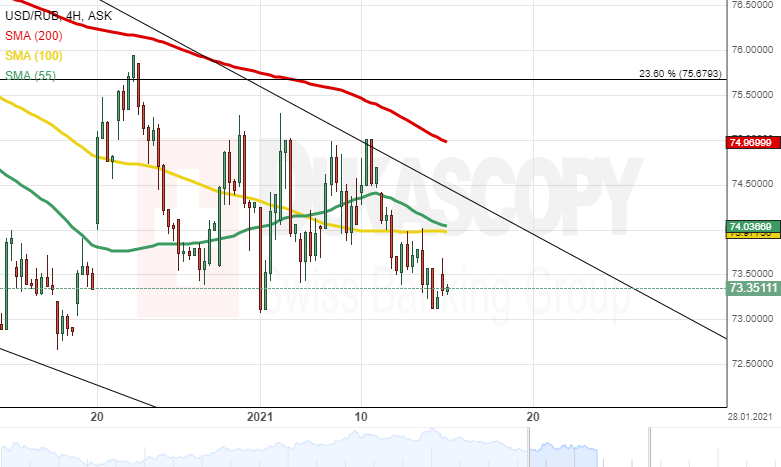
Since October, the USD/RUB currency pair has been trading within a falling wedge pattern.
From a theoretical point of view, it is likely that the exchange rate could continue to move within the predetermined pattern until the beginning of February. Then, a breakout north could occur, and the rate could raise to the 80.00 mark.
Meanwhile, note that the currency pair is pressured by the 55-, 100– and 200-period moving averages in the 74.00/75.10 range. Thus, a breakout south could occur, and the pair could decline to the Fibo 50.00% at 68.75.