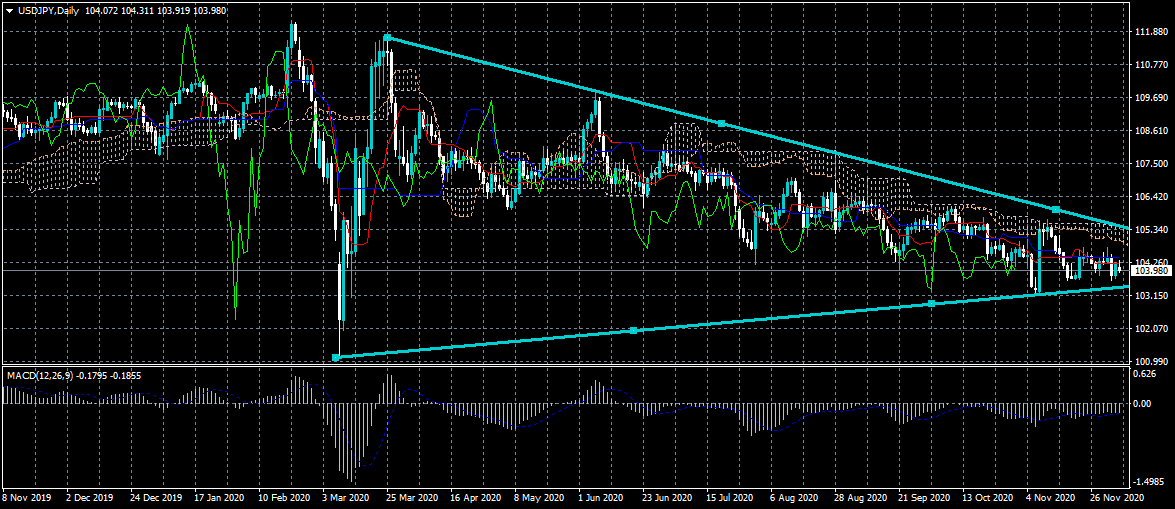
The US dollar is once again trading around the 104.00 support level against the Japanese yen currency after bulls failed to overcome the pivotal 104.50 level. Technical analysis shows that the USDJPY pair is trapped inside an extremely large triangle pattern between the 103.30 and 105.30 levels. The USDJPY pair is likely to experience range-bound trading conditions until a breakout from the triangle occurs.
The USDJPY pair is only bearish while trading below the 104.50 level, key support is found at the 103.80 and 103.50 levels.
The USDJPY pair is only bullish while trading above the 104.50 level, key resistance is found at the 105.30 and 106.00 levels.