Unless you intend on trading one market at a time, it is vital to understand how different instruments markets interact with one another. A correlation, in simple terms, describes how much (or how little) two markets move together over a period of time.
The key thing to remember is that financial markets DO NOT trade in isolation. Currency pairs, for example, deal with TWO economies. You can easily see this by overlaying and comparing different pairs or by simply reading a currency correlation table.
In this article, we’ll attempt to cover not only how currency pairs typically interrelate, but also look at what affect commodities, bonds and equities have on the currency markets. With this being a somewhat extensive subject we’ll do our best to keep it as concise as possible!
These correlations, however, are not fool proof and do from time-to-time deviate. However, they can help a trader immensely if he/she knows how to correctly use them.
Some correlated currency pairs to keep an eye on
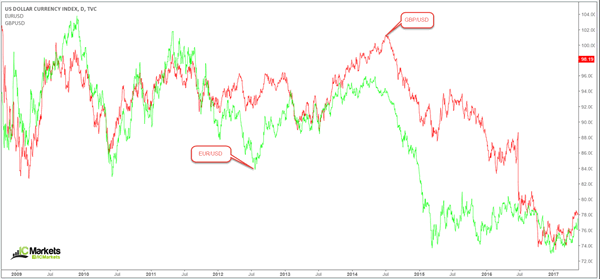
The EUR/USD and GBP/USD usually track each other over 80% of the time. This means that when the EUR/USD puts in a high, you’ll typically see a similar scenario over on the GBP/USD.
The AUD/USD and NZD/USD are two other markets with a similar relationship as above. Notice that these two instruments almost mirror each other exactly. In fact, these markets move in tandem over 70% of the time!
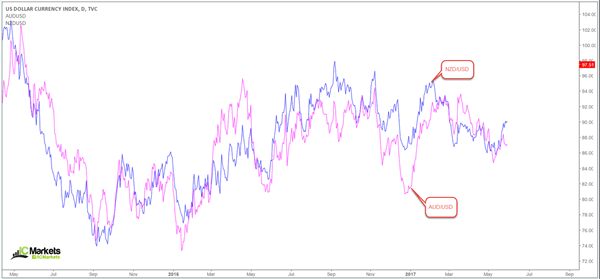
Over the long haul we can expect the above markets to mirror each other’s movements, but there will be times when the correlation deviates and this is usually due to political or economic reasons. Why these correlations exist is largely due to the currency pairs having the quote currency priced in US dollars. For example, imagine that the dollar sold off across the board, this would likely send the EUR, GBP, AUD, and NZD higher. Of course, some markets are more hot-blooded than others, so do not expect each unit to have the same range!
A few inversely correlated currency pairs to pay attention to
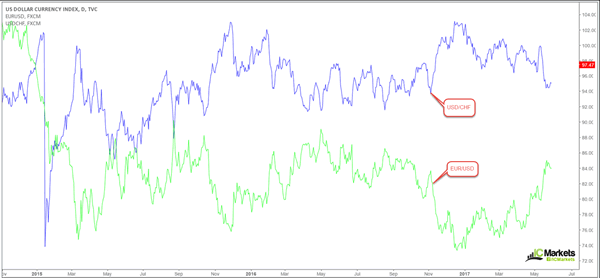
First up is a well-known inverse correlation: the EUR/USD and the USD/CHF. These two pairs tend to trade contrary to one another nearly 90% of the time!
You can see that both pairs have the US dollar in common, one as a quote currency and the other as a base currency. The US dollar is an extremely powerful currency. It is in fact the world’s reserve currency. Therefore, when the dollar is bid, this will typically send the USD/CHF higher and the EUR/USD lower. In addition to this, bear in mind that the GBP/USD pair also has a strong inverse correlation to the USD/CHF.
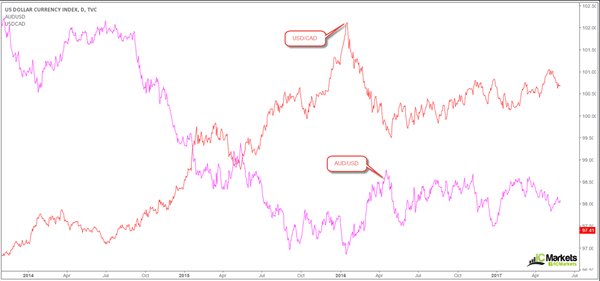
Two other pairs that we also keep a close eye on is the AUD/USD and the USD/CAD. Both pairs generally move opposite to one another around 80% of the time. Both the Aussie and Canadian dollar are considered commodity currencies (we’ll touch on this soon), with a specific relationship to gold and oil. Similarly, like the EUR/USD and the USD/CHF, both pairs have the US dollar in common, again one as a quote currency and the other a base currency.
Intermarket correlations
With a brief understanding of how some currency pairs correlate, it would be unwise not to include additional intermarket correlations between the forex market and other financial markets… Grasping an understanding of how stocks, bonds and commodities affect the currency market is, in our humble view, a technical edge by and of itself.
Gold
Let’s begin by looking at everyone’s favourite yellow metal: gold. Bullion is considered a good hedge against inflation, and is also believed to be a safe-haven asset.
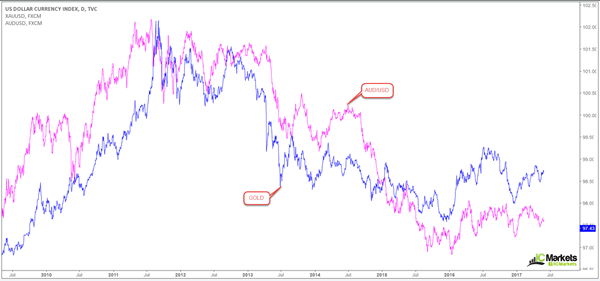
The relationship between gold and the AUD/USD pair is a positive one. Behind China, Australia is the second biggest gold-producing country in the world. So, when the price of gold rallies, the Aussie dollar tends to follow. Therefore, try and avoid buying both the Aussie and gold simultaneously, as you’ll be potentially doubling up on risk.
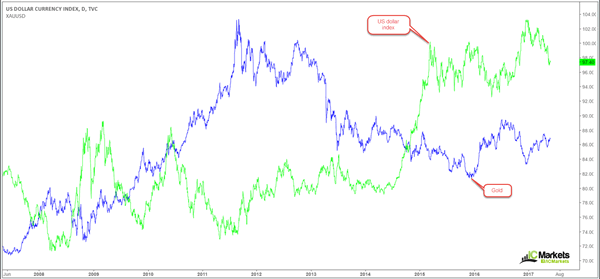
Gold also has an interesting relationship with the US dollar. When the dollar rises in value, it is usually expected to see the price of gold deteriorate. This inverse relationship remains because a falling dollar increases the value of other currencies, and thus increases the demand for gold. When the dollar starts to lose value, investors tend to look for alternative investments, with gold being one of those alternatives. During times of economic unrest, investors also tend to dump the dollar in favour of gold. Unlike other assets, gold maintains its intrinsic value.
Also of interest is the USD/JPY pair and gold. These two instruments continue to trade inversely. This extremely strong correlation shows that gold is, in fact, viewed as a safe-haven asset. So, we can say that gold behaves similarly to the Japanese yen, which is also considered to be a safe-haven currency.
Oil
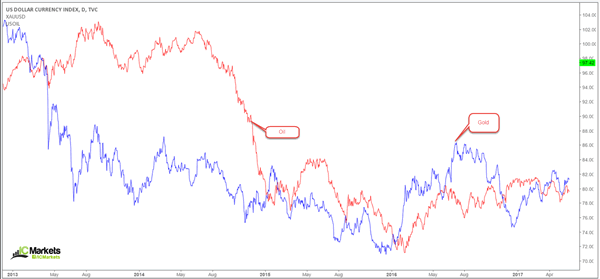
Before we have a look at oil’s effect on currencies, there’s an important link between oil and gold that needs addressing, and that is inflation. As the price of crude rises, inflation also rises. Gold, as we briefly mentioned above, is known to be a good hedge against inflation. Therefore, the value of gold increases when inflation is rising. Over 60% of the time, gold and oil are said to have a positive relationship.
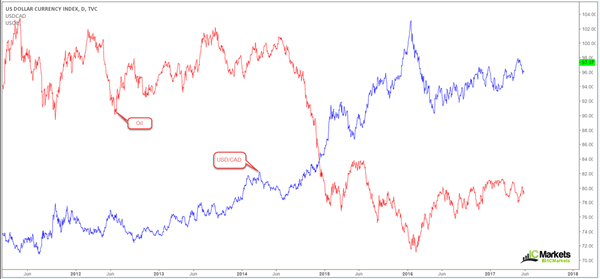
The price of oil also affects the USD/CAD pair. Canada is one of the top oil producers in the world, exporting over 3 million barrels of oil per day to the US. Due to this large volume, the Canadian dollar is in demand. Therefore, if the demand for oil rises, manufactures need more oil which generally leads to a depreciation in the USD/CAD.
US dollar index
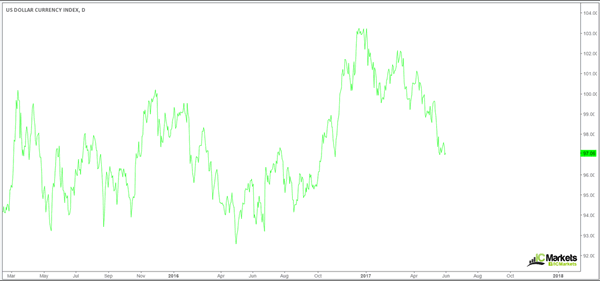
We use this index all of the time as it is beneficial in determining dollar strength. The US dollar index provides investors with a general indication of the value of the US dollar. It does this by averaging the exchange rates between the dollar and six other major currencies (EUR, GBP, JPY, CAD, CHF and SEK). As can be seen from the chart below, the dollar has been struggling since the index topped at highs of 103.0ish. So, with this, we should be seeing a rally in pairs like the EUR/USD, GBP/USD, AUD/USD etc.
Global stock indexes
It might surprise newbie forex traders that there is a relationship present between the global stock markets and currencies. It is certainly something traders/investors should be cognizant of.
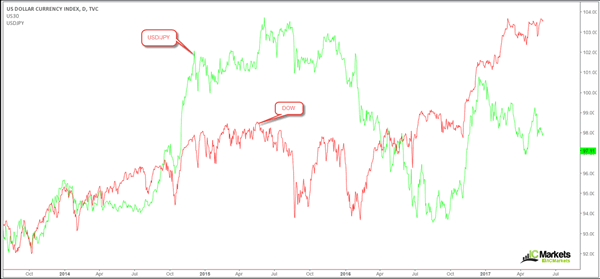
The USD/JPY and the Dow Jones Index generally track each other’s movements. Why? Well, from our perspective, it boils down to investor risk appetite. When traders/investors are feeling optimistic about the global economy (the US in particular), they tend to bid both the dollar and stocks. Conversely, when global risks emerge, market participants typically sell equities and the dollar and buy safe-haven assets like gold and the Japanese yen. As you can see, the correlation is not perfect, but it does tend to track each other close to 70% of the time.
Bonds
For the purpose of this article, we’ll be talking about the ten-year treasury note. Basically, this instrument is a debt obligation issued by the US government that matures in ten years. It is, in effect, an ‘IOU’. So, what does this unit have to do with the currency market?
Falling treasury yields tend to be dollar negative, while rising treasury yields typically support the dollar. Bond yield refers to the rate of return, or interest, paid to the bondholder while the bond price is the amount of money the bondholder pays for the bond. Also, do remember that bond prices and bond yields are inversely correlated. Furthermore, government bond yields act as an indicator of the overall direction of the country’s interest rates and expectations.
Therefore, when the ten-year yield is on the rise, we can expect the USD/JPY pair to generally follow suit.

How can I use these correlations?
Utilising correlation techniques can help you stay out of positions that could cancel each other out.
For example, let’s look at the EUR/USD and the USD/CHF pairs. As we already know, these markets usually trade inverse to one another. So, placing a buy on the EUR/USD and a short on the USD/CHF simultaneously is not a wise move! By the same token, taking a long trade on the EUR/USD and a long on the GBP/USD would, given the close correlation between the two pairs, be similar to doubling your risk!
Having used correlations for years, we like to keep it simple by solely using price action: supply/demand and support/resistance.
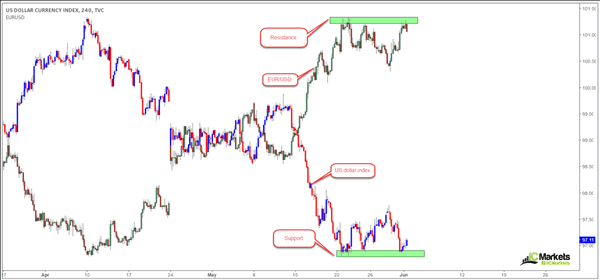
On The chart below, we’ve plotted the EUR/USD and US dollar index together. Notice how the EUR is currently chiselling in an area of resistance, while the US dollar index is busy forming a support area. What’s also notable is the US dollar is showing signs of strength at the moment (look at the current candle), which could imply the EUR/USD will likely see further downside over the next few hours.
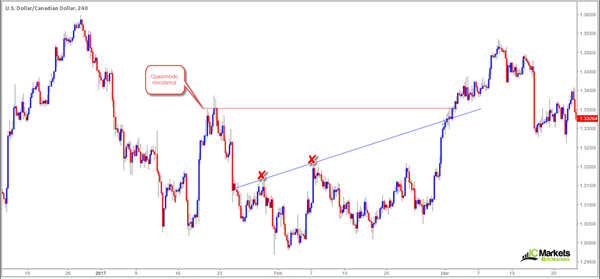
Here’s another interesting example. Say that you wanted to short this H4 bearish selling wick at the underside of the broken trendline on the Aussie H4 chart, which by the way is a beautiful setup. From here, one could check out what the USD/CAD is up to on the H4 chart.
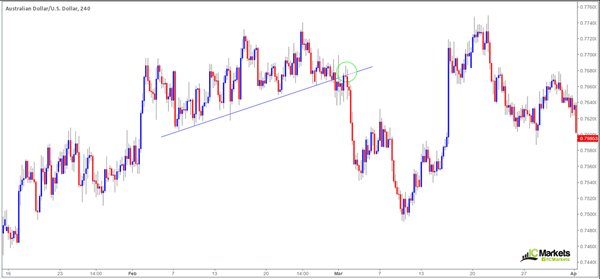
And here’s what we would find: price had actually closed above a H4 trendline resistance a few hours PRIOR to the Aussie striking the underside of the trendline resistance! The only grumble we would have had here though was the Quasimodo resistance level that was sighted just above!
Nevertheless, the USD/CAD had given us an early signal (a correlation confirmation if you will) that Aussie bears may look to strengthen. This – coupled with the Aussie H4 bearish selling wick at the underside of a trendline resistance was, in our humble view, worth the risk.
In closing…
Books have been written on the subject of correlations, so we’ve not even really began to scratch the surface here. As such, we most certainly encourage you to research the world of correlations!
