U.S. Review
Inflation Still Soft in July
- The economic calendar was on the sparse side this week, the most important item being this morning’s CPI update on the inflation picture, which was softer than expected.
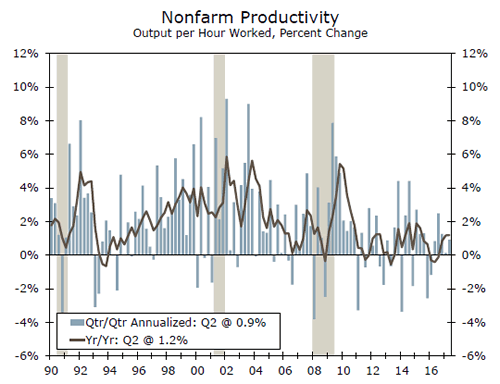
- Fresh productivity data for the second quarter continued to show a sluggish trend, though it did pick up from Q1. Compensation growth slowed and is declining on an annual basis.
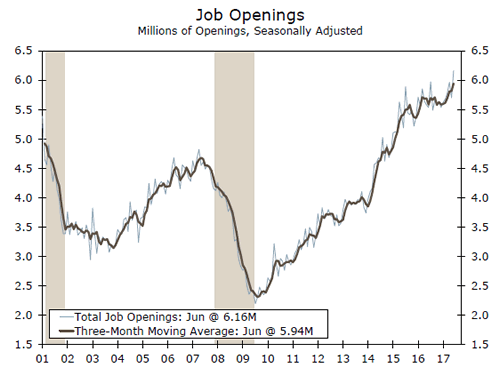
- Strong labor demand was highlighted by the all-time high level of job openings in the June JOLTS report.
Fed to Keep Waiting for Inflation to Firm
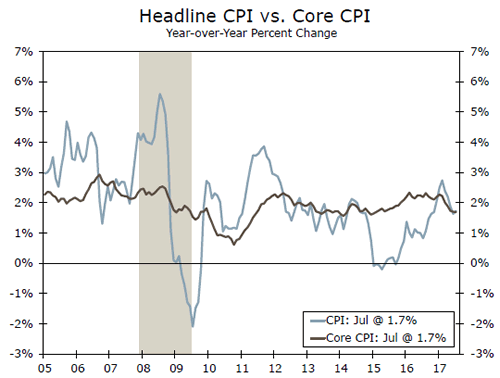
The economic calendar was on the lighter side early this week, as most of the focus was on this morning’s CPI release to provide an indication of whether the inflation data will start to come in more supportive of the FOMC’s goals. Consensus had estimated prices increased at a 0.2 percent pace in July, for both the headline and core CPI. The print came in softer than forecasted for the fourth consecutive month, as both headline and core rose 0.1 percent in July. Both are up 1.7 percent year-over-year. The report did color the inflation story in a few different lights. First, the continued misses suggest that the weakness in inflation is not as transitory as some had posited. The Fed is still likely to push forward with balance sheet reduction in September, but it does not yet have the "all clear" signal from the economic data for a December interest rate hike. Second, the details of the July CPI release were somewhat less disheartening than in June. Prices increased for apparel and recreation after falling in June, and food/beverage prices were up after June’s flat reading. Prices continued to decline for energy and transportation, but at a slower pace. We doubt the Fed will change course just yet. A stronger print today would have given the Fed breathing room, but there are plenty of data points between now and December to navigate.
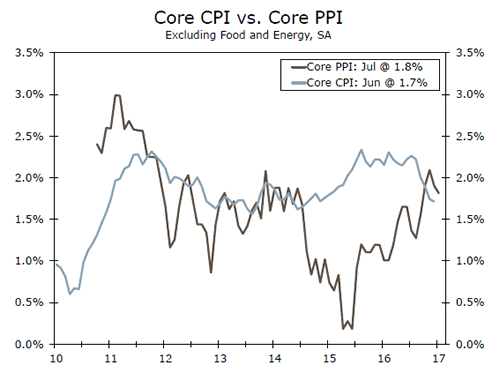
The unexpected decline in producer prices in July, released on Thursday, heightened the anticipation for the CPI reading. The PPI for final demand fell 0.1 percent on broad-based weakness, most notably a huge drop in margins for chemical wholesaling. PPI tends to be volatile month to month, but the report did little to suggest price pressures are building down the pipeline.
The June JOLTS report reinforced that demand for U.S. labor is strong, as the number of job openings was at its highest level of the series at the end of the month. Fewer hires took place in June than in May, though much of that decline was in the Northeast, as hiring increased in most of the other regions of the country. There were also fewer separations from employment due to a smaller number of workers quitting their jobs in June. The quit rate has been oscillating between 2.1 percent and 2.2 percent every other month this year; 2.2 percent is the upper bound of the current cycle and 2.3 percent is the high point of the prior cycle. It will be interesting to watch in the coming months whether that rate breaks out in either direction. As an increase in the quit rate would support an increase in average hourly earnings, the fact that the quit rate has been "stuck" this year may help explain the disappointing wage growth we have seen.
Judging by the high number of open positions, the demand for workers is there and to fill them, we will need either more people to quit their current jobs or entice more workers to enter the labor force. The trend in productivity growth remains sluggish. The rate of nonfarm output and hours worked increased slightly more than expected in the second quarter at a 0.9 percent annualized rate. The year over year growth of 1.2 percent remains below even the tepid trend of the current cycle. Until we see a breakthrough on the productivity front, our economy is likely to expand at a 2-2.5 percent pace.
U.S. Outlook
Retail Sales • Tuesday
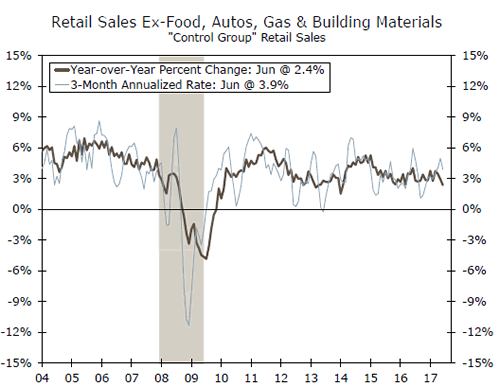
Retail sales posted a disappointing 0.2 percent decline in June amid broad-based declines in sales. While softer prices for consumer goods including gasoline likely played a role in holding back the nominally reported number, there were signs of weakness in consumer demand. The closely watched control group, which feeds into the calculation for GDP, declined 0.1 percent. With gasoline prices trending higher over the last month, we suspect that somewhat higher inflation helped to boost headline retail sales to 0.3 percent in July. Excluding automobile sales, we expect sales increased 0.3 percent for the month. With a continued modest pace of both inflation and real consumer spending, we expect retail sales will average roughly 3 percent in the second half of this year. Real consumer spending is forecasted to expand at a 2.3 percent pace over the third and fourth quarters of this year.
Previous: -0.2% Wells Fargo: 0.3% Consensus: 0.4% (Month-over-Month)
Housing Starts • Wednesday
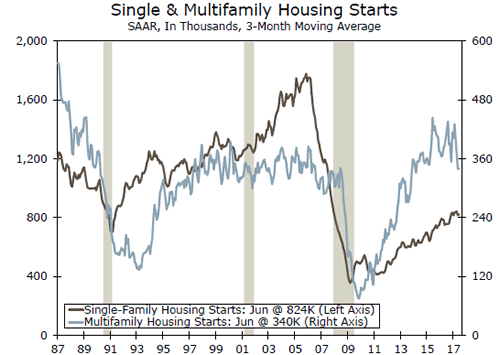
Housing starts rose 8.3 percent in June to a 1.215 million-unit pace. With unseasonably warm weather to start the year, June’s increase marked the first positive reading for starts since February of this year. As can be seen in the graph to the left, the story has been a steady but gradual improvement in single family starts, but multifamily starts have begun to decelerate in the wake of a multiyear surge in apartment market building. Looking ahead to July’s reading, we expect another modest improvement in housing starts for the month with an increase of 1.2 percent to a 1.229 million unit pace. As we look ahead to the second half, we estimate that housing starts will total 1.24 million 2017 and improve to a 1.32 million unit pace in 2018 as single-family building activity begins to pick up amid a tight supply of existing homes.
Previous: 1215K Wells Farg
Industrial Production • Thursday
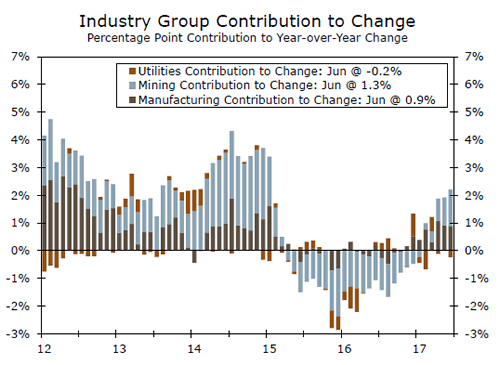
Industrial production rose 0.4 percent in June as both manufacturing and mining overcame a decline in utilities output. Mining activity has played an outsized role in holding back industrial production growth since the middle of 2015, a trend that has reversed over the past few quarters. Another factor that has adversely affected industrial output has been the very weak pace of manufacturing output, held back in part due to soft global growth. With mining activity improving and global economic data beginning to surprise to the upside, we are marginally more positive on the outlook for industrial production. We expect industrial output rose 0.4 percent in July. In the second half, we expect output will expand at an average of 2.5 percent on an annualized basis. If current trends hold, 2017 will mark the first year-over-year growth in industrial output since 2014.
Previous: 0.4% Wells Fargo:
Global Review
Recent Economic Developments in South Korea
- The South Korean economy has expanded at a steady, albeit slow pace, over the past few years, and we expect the expansion to continue through the end of 2018. Rising tensions with North Korea clearly represent an immediate downside risk to the South Korean economic outlook.
- The build-up in leverage in the household sector represents a longer-term risk to the South Korean economic outlook. Although we do not look for the central bank to be "jacking up" rates anytime soon, growth in consumer spending could be depressed once a higher interest rate environment finally comes to pass.
Recent Economic Developments in South Korea
With tensions rising this week between the United States and North Korea, we thought we would take the opportunity to provide readers with an update on the South Korean economy. Measured at current exchange rates, South Korea had the 11th largest economy in the world in 2016 with nominal GDP equivalent to $1.4 trillion. As has been the experience of most economies, South Korea has experienced a slower rate of economic growth in recent years with real GDP growing at an annual average rate of only 2.8 percent between 2012 and 2016. We project that the economic expansion in South Korea will continue for the foreseeable future with real GDP growing 2.9 percent in 2017 and 2.8 percent next year. Of course, a war on the Korean peninsula, should one come to pass, would have profound effects on our growth forecasts.
Growth in the rest of the world is important for the South Korean economy because real exports of goods and services are equivalent to about 55 percent of GDP. China takes in one-quarter of South Korea’s exports, making it South Korea’s most important export market by a wide margin. So, economic deceleration in China since the beginning of the decade has exerted a slowing effect on the South Korean economy. However, South Korea has also experienced deceleration in its productive capacity as growth in its working-age population has slowed in recent years. The unemployment rate has trended up from about 3 percent or so in 2014 to its present rate of 3.8 percent, which is high by South Korean standards.
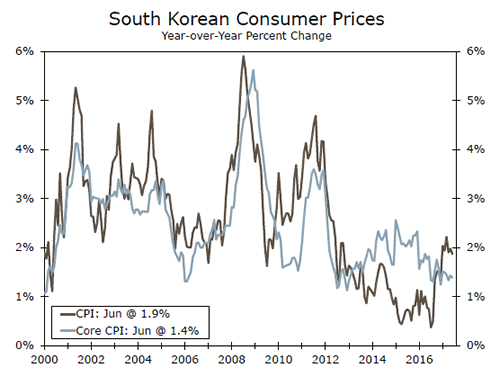
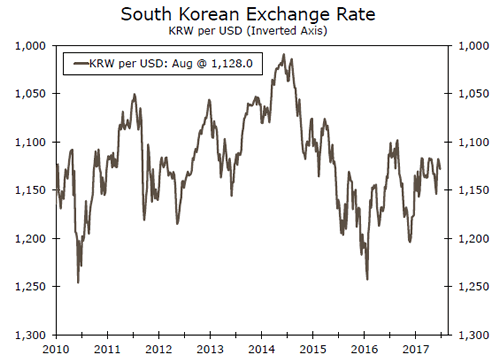
This slow growth environment has depressed rates of CPI inflation in South Korea (top chart). Consequently, the Bank of Korea cut its main policy rate from 3.25 percent in mid-2012 to 1.25 percent today. The combination of lower rates in South Korea in conjunction with expectations of higher U.S. rates caused the Korean won to depreciate nearly 20 percent versus the U.S. dollar between mid-2014 and early 2016 (middle chart). The won has recouped some of its losses over the past year, but it could come under downward pressure again if tensions between the United States and North Korea escalate further. Indeed, the won fell versus the greenback this week as tensions rose.
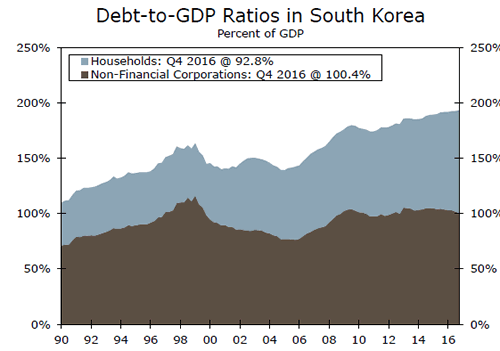
Clearly, a confrontation with the North represents a clear and immediate downside risk to the South Korean economy. A buildup of financial leverage represents a longer-term economic risk. The debt-to-GDP ratio in the non-financial corporate sector peaked ahead of the financial crisis in 1997-1998, and it has been stable on balance subsequently (bottom chart). However, the debt-to-GDP ratio of the household sector has trended up from about 40 percent in the early 1990s to more than 90 percent today. Although we do not look for the central bank to be "jacking up" rates anytime soon, growth in consumer spending could be depressed once a higher interest rate environment finally comes to pass.
Global Outlook
Japanese GDP • Monday
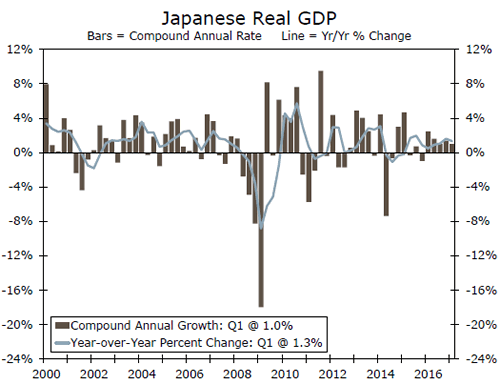
The Japanese economy has built some momentum of late, although on a relative basis growth remains softer in Japan than in most other advanced nations. An improved global growth environment has provided a boost; Japanese merchandise export volumes were up 4.0 percent year-over-year in June. Industrial production has followed, growing 4.9 percent over the same period.
If Q2 real GDP growth is positive, as we expect, this would be the sixth consecutive quarter of positive growth—the first time this has happened in Japan in more than a decade. Economic growth remains far from robust, however, and with consumer prices essentially flat over the past year, we believe the Bank of Japan will remain committed to its accommodative monetary policy measures for the foreseeable future.
Previous: 1.0% Wells Fargo: 2.2% Consensus: 2.5% (Quarter-over-Quarter, Annualized)
Chinese Industrial Production • Monday
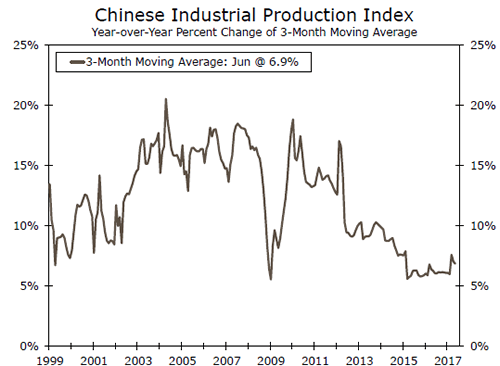
Industrial production growth in China has stabilized since 2015 as policymakers have provided stimulus in the form of easier credit to support the economy. Combined with stronger demand abroad, industrial production and economic growth more broadly have been remarkably stable in China recently. Chinese consumption has also firmed against this backdrop. Data on retail sales in July, which also print next week, have grown at roughly an 11 percent year-over-year pace for most of the past year.
Chinese authorities are faced with the daunting task of deleveraging the non-financial corporate sector while also threading the needle on the government’s economic growth target. Next week’s indicator readings will likely show that economic activity in China was quite stable to start Q3, but we expect economic growth to slow gradually later this year and through 2018 as an aging population and high debt loads weigh on labor and capital growth.
Previous: 7.6% Consensus: 7.1% (Year-over-Year)
United Kingdom CPI • Tuesday
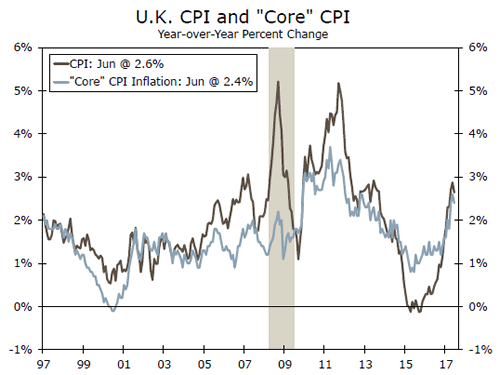
Monetary policymakers in the U.K. are among the few central bankers in the advanced world facing too fast, rather than too slow, inflation. CPI inflation has shot higher, at least in part, due to the marked depreciation of sterling in the wake of last year’s Brexit referendum. Faster inflation and stagnant wage growth have taken a bite out of household’s real disposable income, exerting some headwinds on consumer spending. Of the advanced economies for which we explicitly forecast economic growth, the U.K. economy is the sole one we expect to decelerate in 2017 relative to 2016.
The Monetary Policy Committee of the Bank of England (BoE) expects inflation to rise further in the coming months and to peak at around 3 percent in October before the inflationary pressure from the sterling’s depreciation begins to fade. If the U.K. economy can achieve some modest strengthening over the next 18 months as we expect, the BoE could raise rates as soon as next spring.
Previous: 2.6% Wells Fargo: 2.5% Consensus: 2.7% (Year-over-Year)
Point of View
Interest Rate Watch
Net Treasury Issuance Update
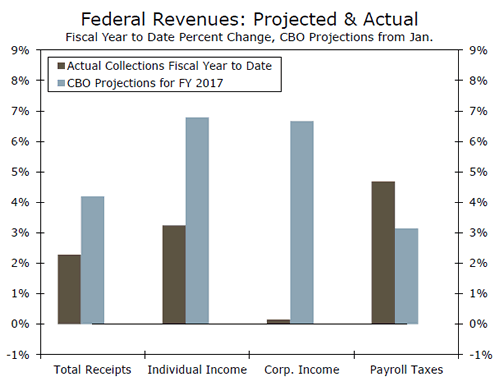
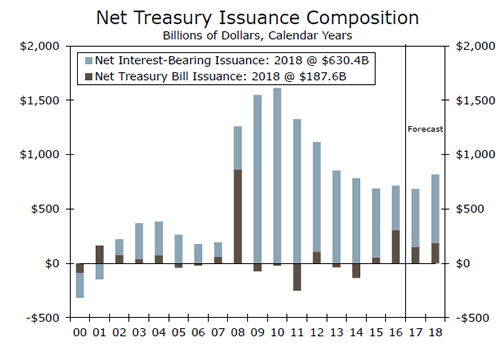
In response to continued lower-thanexpected tax collections, we have increased our deficit estimate for the FY 2017 budget deficit to $700 billion and reduced our estimate for FY 2018 to $875 billion. The key factor behind our revision has been the consistent under-performance of both individual and corporate tax collections. As we wrote last month, in our view, the possibility of tax cuts next year has some individuals delaying the realization of capital gains taxes with the hope of a lower rate next year.
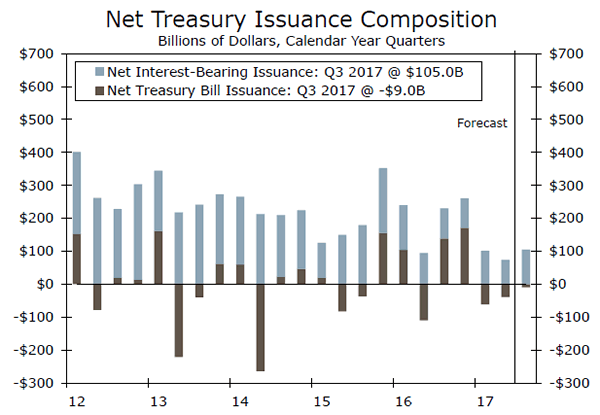
In light of our new budget deficit estimates and the latest information from the Treasury’s Quarterly Refunding Statement, we now expect net Treasury issuance to total $685 billion for calendar year 2017 and $818 billion for calendar year 2018. While uncertainty remains about the potential for tax cuts next year and thus larger deficits, even in the absence of tax cuts we still expect larger budget deficits and thus higher net Treasury issuance next calendar year.
The story all year has been a paydown in the Treasury’s cash balance after the reestablishment of the debt ceiling last March. This cash balance paydown has pulled T-bills off the market since Q2 of this year, a story we expect to continue in Q3. Given that the Treasury is still taking "extraordinary measures" to stay below the borrowing limit and because we do not expect the debt ceiling to be lifted until the middle or end of September, net Treasury issuance is expected to be light again in the third quarter at $96 billion with $105 billion in net interest-bearing issuance and a T-bill paydown of $9 billion. Looking ahead to the fourth quarter, we expect a large jump in net Treasury issuance on the other side of the debt ceiling increase. The Treasury is expected to replenish its cash balance in addition to financing a larger budget deficit in first quarter of the 2018 fiscal year (Q4 of the 2017 calendar year). We expect net Treasury issuance in Q4 of this calendar year to rise by $501 billion which, combined with our estimated budget deficit, would result in a December ending cash balance of $224 billion.
Credit Market Insights
Credit Standards Tightening in Q3
Last week, the Q3 Senior Loan Officer Survey was released. The report indicated a sense of caution among both consumer credit as well as business lending demand, with each slowing on the quarter.
The survey showed that banks’ willingness to lend has decreased over the past five years, which matches the trend of each economic cycle since the 1980s. Coming out of the recession, banks were very willing to extend credit to consumers. However, as the cycle matures, banks begin to tighten lending; the current increase in auto and credit card delinquencies could be the driver behind the decreasing lending appetite of banks.
Consumer demand has also fallen at a steady pace since 2012, despite the historically tight labor market and employment figures. This indicates a sense of caution among individual consumers, and household debt service as a percentage of income currently sits at decade lows.
The net percent of banks reporting stronger demand from large and medium size firms dropped to -11.8 percent in Q3, indicating that demand among such firms has been weaker. This has been trending downward since 2014. This reduced appetite for debt among these firms may be driven by slowing final sales. With slower final sales growth, the need to expand inventory from its currently low levels has diminished. Without the need to expand inventory levels, the need for equipment financing has dropped concurrently.
Topic of the Week
U.S. Economy Has Low Sensitivity to Dollar
The trade-weighted value of the U.S. dollar has declined about 7 percent since the beginning of the year, and our currency strategy team looks for it to fall further on a trend basis in coming quarters. So, will this dollar depreciation have significant effects on the U.S. economy?
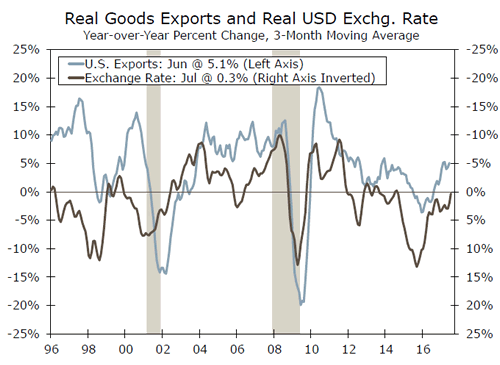
Probably not. Let’s start with the effects of a weaker dollar on U.S. GDP growth. As shown in the top chart, there is an inverse correlation between growth in real exports and changes in the real value of the dollar. That is, as the dollar depreciates on a real basis, growth in real exports tends to strengthen and vice versa. However, the degree of correlation between these two variables is not all that high. The sensitivity of export growth is much higher for changes in foreign economic growth than it is to changes in the real value of the dollar. Furthermore, real exports of goods and services account for only 13 percent of U.S. GDP. The bottom line is that changes in the value of the dollar have little meaningful effect on the overall rate of U.S. real GDP growth.
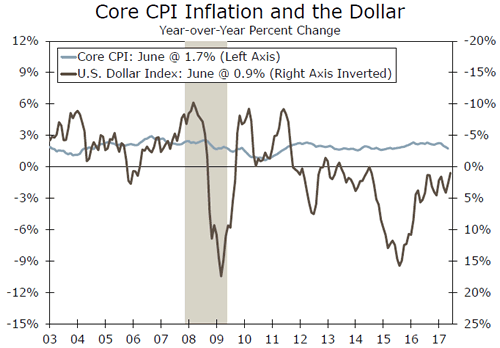
Changes in the value of the dollar also have little meaningful effect on the rate of core CPI inflation in the United States (bottom chart). The degree of correlation between changes in the value of the dollar and changes in import prices is rather high. However, the U.S. economy is largely a service-based economy, and the vast majority of services are produced and consumed domestically. Consequently, changes in the value of the U.S. dollar do not have much effect on rates of overall U.S. CPI inflation. If the rate of dollar depreciation in coming quarters remains modest, which is our expectation, then CPI inflation is not likely to change much due solely to the effects of dollar depreciation.
