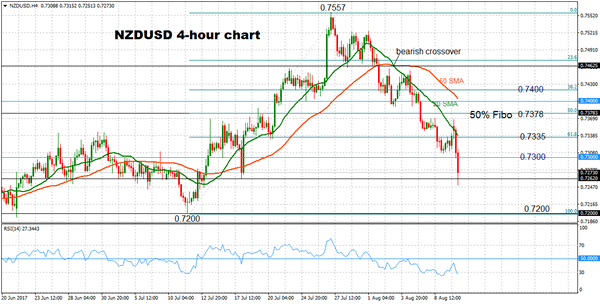
NZDUSD turned increasingly bearish on the 4-hour chart after being unable to sustain a break above a key resistance level at 0.7335. Downside momentum increased and prices briefly dipped to a 2-month low of 0.7251.
There is risk for a further extension lower to target the key 0.7200 level, resulting in a full retracement of the uptrend that took place from the July 11 low to the July 27 multi-year high of 0.7557.
Upside moves are likely to find resistance at 0.7300 (psychological level), 0.7335 (61.8% Fibonacci of July uptrend), 0.7378 (50% Fibonacci). Only a move back above the key 0.7400 level would ease downside pressure and shift the bias back to the upside.
The bearish bias is confirmed by the negatively aligned short-term moving averages. The 20-period SMA crossed below the 50-period SMA on August 3 and continues to point down, capping the market below it. The RSI is below 50 in bearish territory, although within oversold levels, which could temporarily pause the decline in prices.

