- Alphabet stock (GOOG) is showing its bullishness by attempting to break above the 21 ema zone. What are the main targets?
- GOOG’s first major obstacle is the head and shoulders reversal chart pattern (red boxes). Price is expected to make a light pullback at that zone.
- The main method to recognize whether price is in a real trend or larger correction is to keep an eye on the patterns after price reaches the targets.
Alphabet stock (GOOG) is showing its bullishness by attempting to break above the 21 ema zone. The bullish rally started after price action completed a bearish pullback at the 50% Fibonacci retracement level. What are the main targets?
Price Charts and Technical Analysis
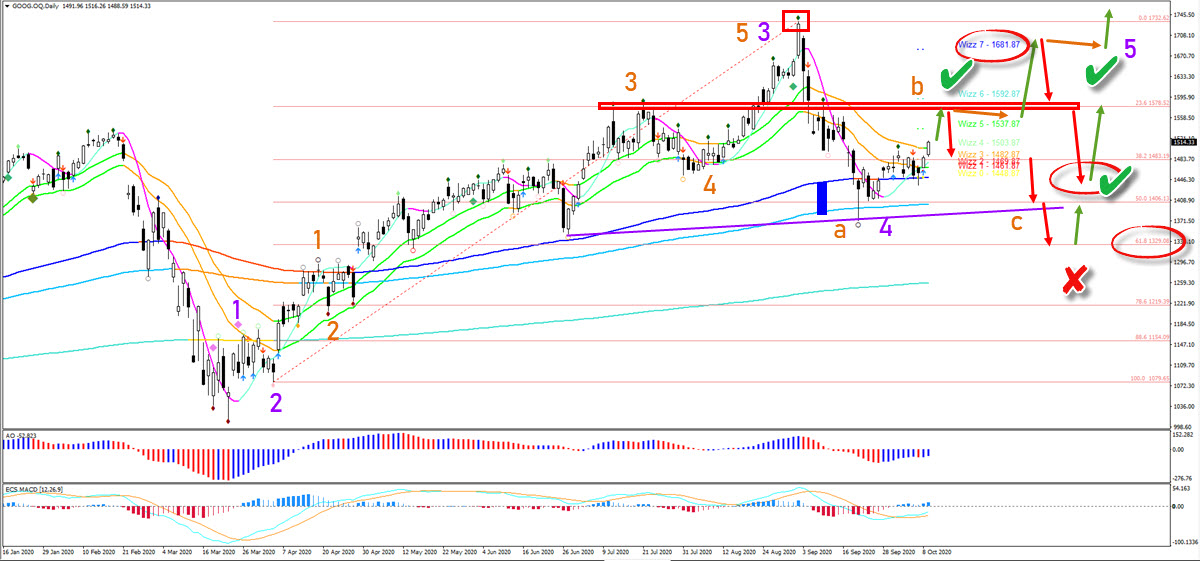
GOOG’s first major obstacle is the head and shoulders reversal chart pattern (red boxes). Price is expected to make a light pullback at that zone but then continue higher towards the Wizz target (orange and green arrows).
Only if price action were to show very strong bearish pressure (red arrow) at the resistance would the bullish outlook change. In that case, a deeper pullback towards the 61.8% Fibonacci level is possible.
A bearish bounce at the Wizz 7 target could indicate a larger ABC (orange) or ABCDE correction within wave 4 (purple). A break above the Wizz 7 confirms the wave 5 (purple).
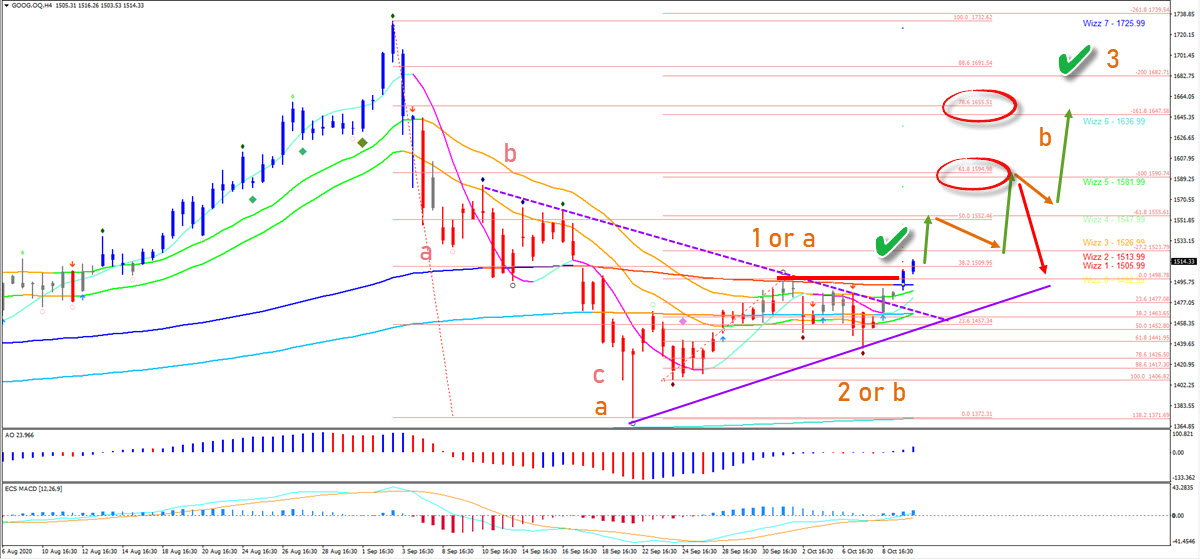
The 4 hour chart has price action showing a break out above the local resistance (red). The blue candles from Elliott Wave indicators confirm the bullishness.
A first target is located at the 61.8% Fib and -100% Fib target (red circle). A bearish bounce at either of the two targets (red circle) indicates a wave B (orange). A break above those targets confirms a wave 3 and much more upside.
The main method to recognize whether price is in a real trend or larger correction is to keep an eye on the patterns after price reaches the targets:
- Strong bearish price action indicates reversal.
- Sideways price movement indicates bullish continuation.