
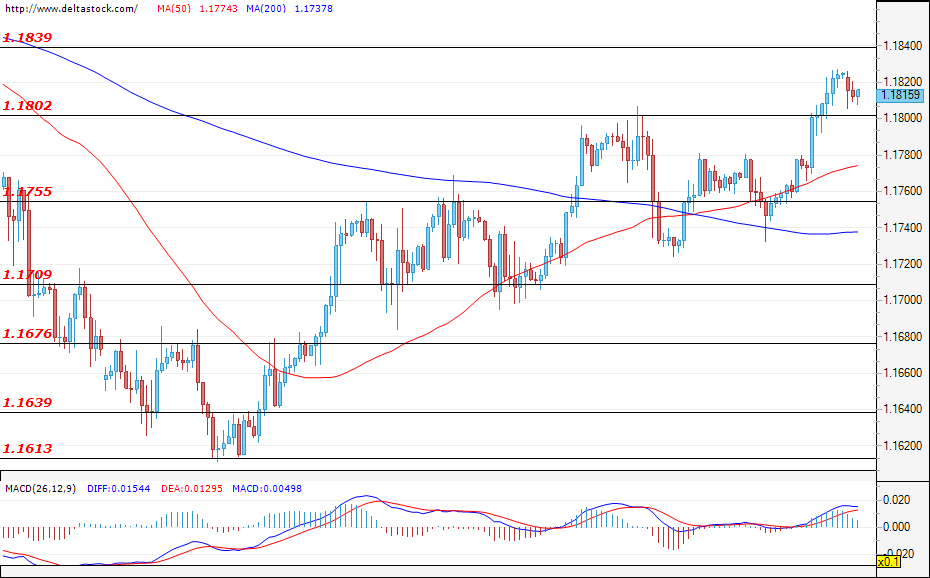
EUR/USD
Current level – 1.1815
The common European currency finished in the green last week as it managed to violate the resistance at 1.1802 during the last trading session. The expectations at the start of the new week are for the rally to continue with a test of the level of 1.1839, possibly followed by a move towards 1.1870. If a correction occurs, it should be limited by the support at 1.1709. This week, the most important economic news that can have a significant impact on the currency pair, is the core CPI data for the U.S. (Tuesday; 12:30 GMT) and the retail sales data for the U.S. (Friday; 12:30 GMT).
| Resistance | Support | ||
| intraday | intraweek | intraday | intraweek |
| 1.1840 | 1.1840 | 1.1802 | 1.1640 |
| 1.1870 | 1.1870 | 1.1709 | 1.1610 |
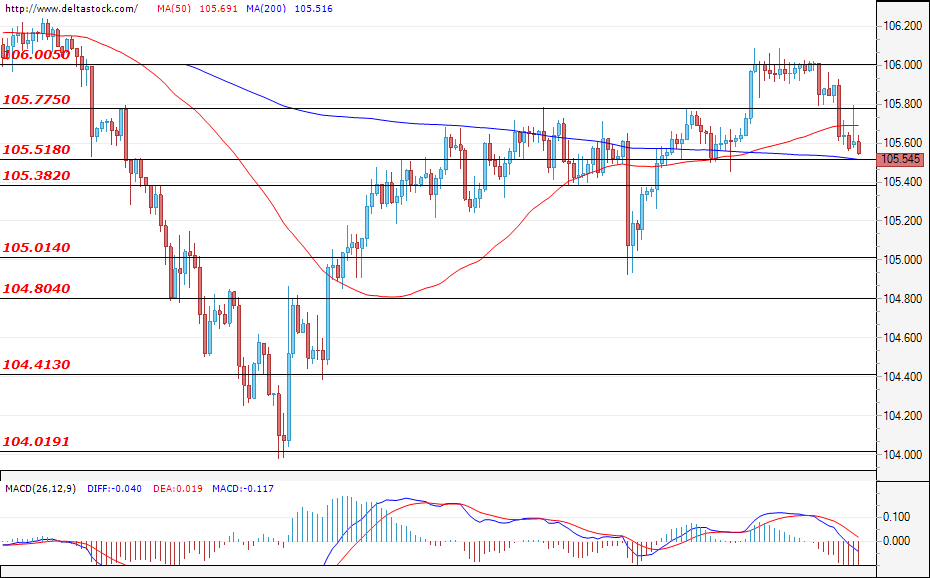
USD/JPY
Current level – 105.54
After the failed test of 106.00, the currency pair breached the support at 105.80 and is now headed for a test of the next support level of 105.50. If the dollar keeps losing ground against the yen, we could even witness a test of the key support at 105.00. In the opposite direction, only a confirmed breach of the resistance at 106.00 would signal a return to bullish sentiment and a possible attack of the levels at around 108.00-109.00.
| Resistance | Support | ||
| intraday | intraweek | intraday | intraweek |
| 105.80 | 106.50 | 105.50 | 105.40 |
| 106.00 | 107.20 | 105.00 | 104.80 |
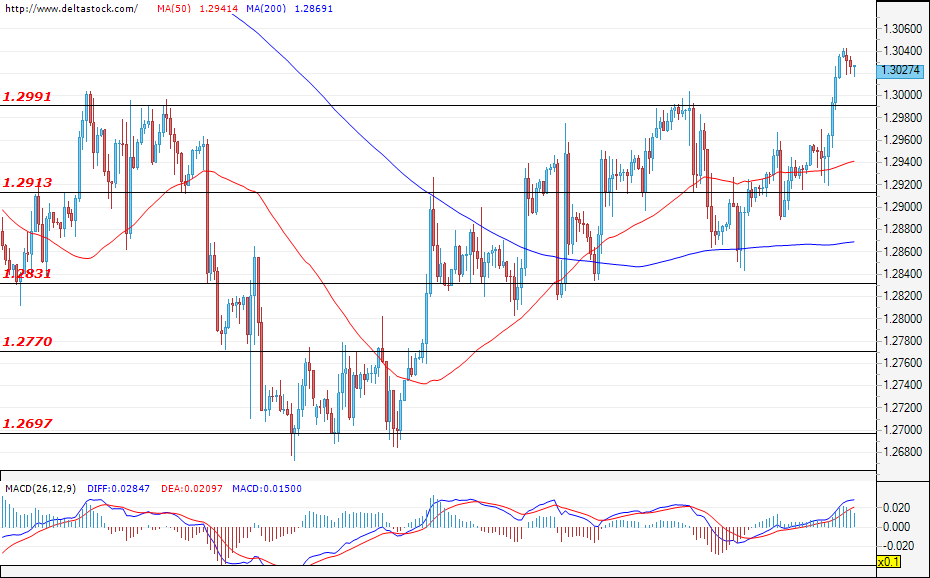
GBP/USD
Current level – 1.3027
Although the Cable managed to breach the resistance at 1.2990 at the end of last week, the continuing Brexit negotiations between the EU and the UK, as well as the potential implementation of new restrictions aimed at slowing down the spread of COVID-19 in the UK, will most probably limit the upside potential for the GBP. At the moment, the most likely scenario is for the pair to go back below 1.2990 and test the support at 1.2913. In the positive direction, only a successful breach of the resistance from the larger time frames at 1.3050 would incentivise the bulls to attack the level at around 1.3100 and further up.
| Resistance | Support | ||
| intraday | intraweek | intraday | intraweek |
| 1.3050 | 1.3050 | 1.2990 | 1.2770 |
| 1.3100 | 1.3146 | 1.2913 | 1.2700 |