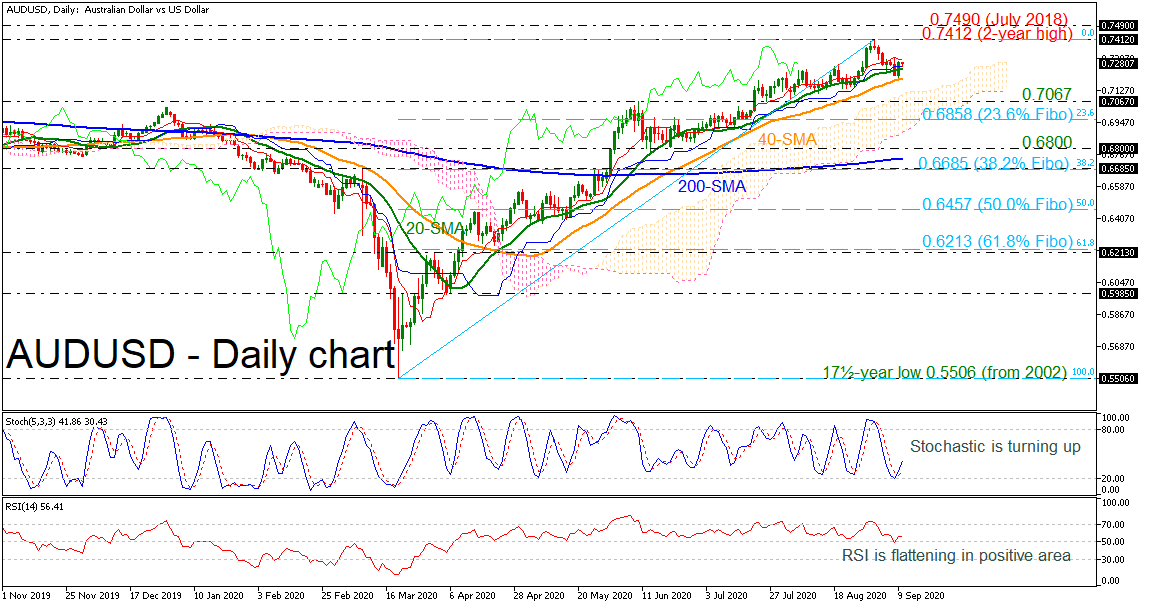
AUDUSD has ticked up on Wednesday, paring the previous days’ losses, following the bounce off the 40-day simple moving average (SMA) at 0.7188. Currently, the price has been holding in an ascending movement since March 19, remaining above the Ichimoku cloud. The technical indicators are edging up as the stochastic posted a bullish crossover within its %K and %D lines after the rebound on the 20 level, while the RSI is flattening above the 50 level.
Should the market extend gains, resistance could be met between the two-year high of 0.7412 and the 0.7490 peak, taken from the high on July 2018. A significant leg above this area could send prices towards the 0.7655 resistance, registered on June 2018.
On the flip side, a drop below the 40-day SMA could reach the 0.7067 support before touching the 23.6% Fibonacci retracement level of the up leg from 0.5506 to 0.7412 at 0.6858. Steeper decreases could drive the market until the 0.6800 psychological level before the 200-day SMA at 0.6742.
In the bigger picture, the pair is bullish as long as it holds above the 200-day SMA. In case it violates this line, bears could take the upper hand.