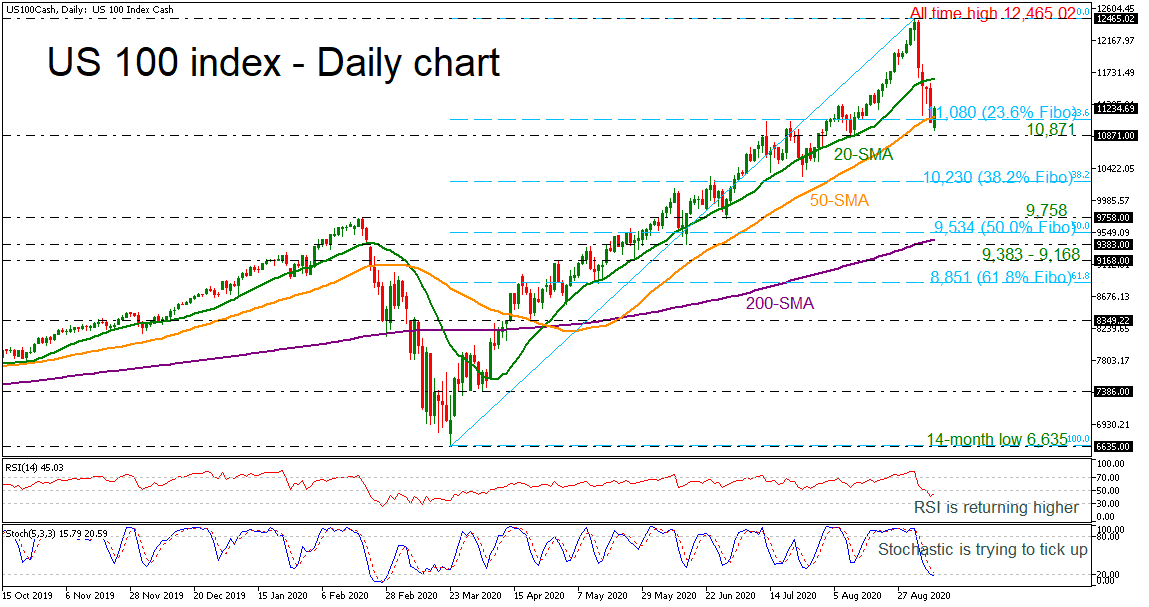
The US 100 index plummeted for four straight days below the 20- and 50-day simple moving averages (SMAs) after the aggressive rally to a new record high from 12,465.02. Currently, the price is trying to pare some of the losses, flirting with the 23.6% Fibonacci retracement level of the bullish move from 6,635 to 12,465.02 at 11,080.
According to the technical indicators, the RSI is turning higher in the negative territory, however, the stochastic oscillator is still in the oversold zone, but it seems ready for an upside move.
If the price recoups some ground and successfully surpasses the 23.6% Fibonacci of 11,080 and the 50-day SMA, it could move towards the 20-day SMA at 11,649.
On the other side if the selling pressure persists, immediate support is coming from the 10,871 barrier. Falling below this level, the 38.2% Fibonacci of 10,230 could come into spotlight ahead of the 9,758 support level.
To sum up, the strong bullish action is not fading in the long-term timeframe, despite the latest down fall.