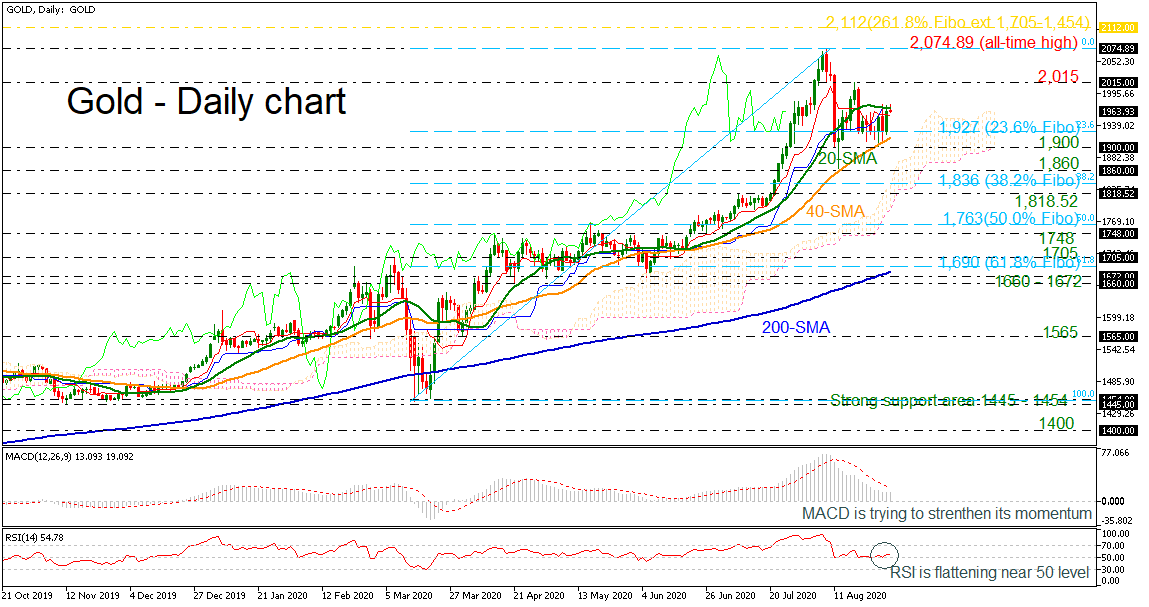
Gold prices have been capped by the 20-day simple moving average (SMA) but have found strong support at the 1,900 psychological level.
The sideways move over the last week is confirmed by the RSI indicator, which is flattening near the neutral threshold of 50, while the red Tenkan-sen and the blue Kijun-sen lines are moving horizontally as well. However, the MACD oscillator is trying to strengthen its momentum below its trigger line and above the zero level.
A successful jump above the 20-day SMA could take the commodity towards the 2,015 barrier before meeting the record high of 2,074.89. Breaching this resistance, the market could challenge the 261.8% Fibonacci extension level of the down leg from 1,705 to 1,454 at 2,112.
On the other side, a downside move could find immediate support at the 23.6% Fibonacci retracement level of the upward wave from 1,454 to 2.074.89 at 1,974, inside the Ichimoku cloud. Moving lower, the 40-day SMA at 1,917 and the 1,900 handle could attract attention ahead of the 1,860 obstacle. If sellers continue to have the upper hand, the 38.2% Fibonacci of 1,836 could be the next target.
Concluding, the yellow metal is showing some signals for a bearish pullback in the very short-term, however, the longer-term outlook remains bullish.