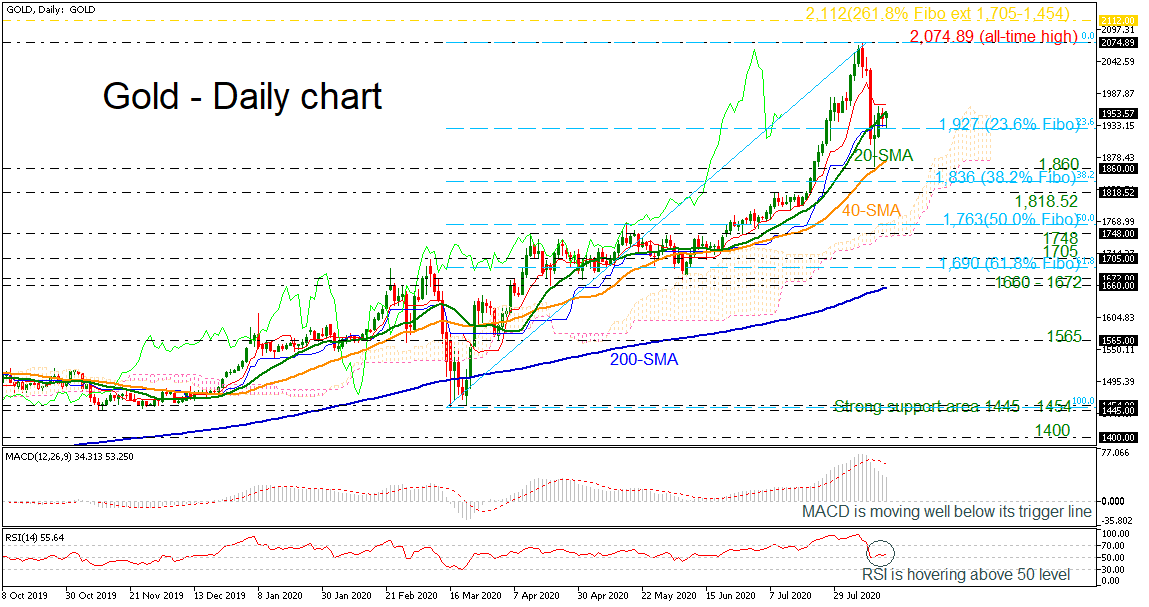
Gold prices are returning slightly higher after the aggressive selling interest from the all-time high of 2,074.89 achieved on August 7. The price found immediate resistance at the 20-day simple moving average (SMA), while the technical indicators seem to be mixed. The MACD oscillator is falling well below the trigger line, though the RSI is pointing marginally up near the neutral threshold of 50.
If the price recoups some of the losses and jumps above the flat red Tenkan-sen line, it could open the way for the record high around 2,074.89. A successful break above this obstacle could touch the 261.8% Fibonacci extension level of the down leg from 1,705 to 1,454 at 2,112.
On the other hand, a downside move beneath the 23.6% Fibonacci retracement level of the upward wave from 1,454 to 2,074.89 could meet the 40-day SMA at 1,873 ahead of the 1,860 support level. Breaching this zone, the 38.2% Fibonacci of 1,836 and the 1,818.52 barrier could come next.
Overall, the precious metal has been in a strong upside tendency since March 16 and only a decrease below the 200-day SMA around 1,660 may change the current outlook.